
POPULATION: The United Nations Forecasting Team is Wrong
Assumptions are everything.

WORLD - 1.4 TFR FLOOR APPLIED
AFRICA - 1.4 TFR FLOOR APPLIED
ASIA - 1.4 TFR FLOOR APPLIED
NORTH AMERICA - 1.4 TFR FLOOR APPLIED
EUROPE - 1.4 TFR FLOOR APPLIED
SOUTH AMERICA - 1.4 TFR FLOOR APPLIED
OCEANIA - 1.4 TFR FLOOR APPLIED
The above graphs were a fiction. A calculated deception. Obfuscation by “sophistication”. They are utilizing the same questionable assumptions as the UN; most crucially the TFR anchoring. TFR meaning the total fertility rate; a measure of how many children a woman will have over her lifetime.
Keep in mind the crucial “1.4 TFR Floor” affixed to each region’s graph.
UN population modeling has gone from realism to plausible academic cover. This is a result of public backlash for “wrong” numbers which could be attributed to any number of issues like data quality, assumptions, and the general complexity of dynamic systems. How do people decide when to have a child? Is there a formula? Complex systems are full of both positive and negative feedback loops, as well as saturation curves and reversal mechanics.
The CIA has gone through the necessary evil of constructing and backtesting its own in house demographic projection engine. This is your first clue that we are not making qualitative analyses. Quantitative pipelines are behind every conclusion.
United Nations - Glasshouse of Questionable Assumptions
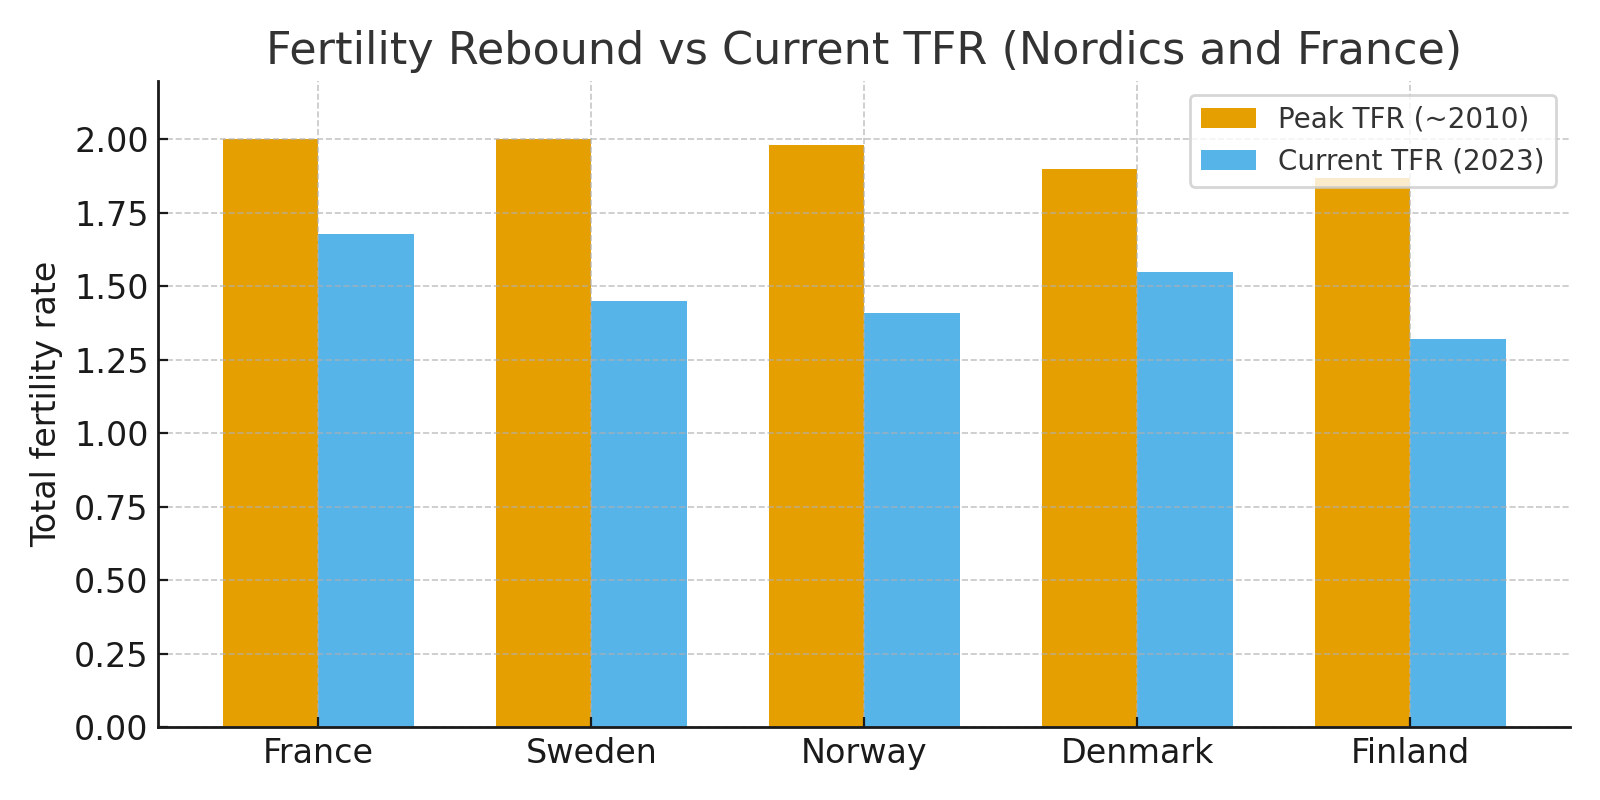
1. Total Fertility Rate is mean reverting and will rebound by 2100.
This was due to the observed rebound in some European countries. This rebound has been observably wrong. It is not communicated at all to the general public and most policymakers likely do not read footnotes. The world has been watching much of East Asia decline in TFR with no end in sight for decades now.
2. Mortality rates will continue to decline as observed in the past.
While global life expectancy is recovering, it has not yet returned to pre-pandemic levels in many regions. Stagnation or slow growth is evident in high-income countries, particularly the U.S. and UK. Through the construction of The CIA demographic engine, it was easy to see that manipulating the mortality rates and their improvement, plateauing, or decline would have a drastic effect on the shape of the population curve. The current engine simply assumes that mainstream models are correct and there will be very slow increases over time. The CIA harbors doubts but for mainstream congruence, we do not explicitly challenge this assumption and negatively affect the mortality rates. The engine uses the exact same UN mortality life tables for the improvement rate and the cap on life expectancy. The UN has no empirical defense when the CIA model still shows a drastically lower population number.
Per continent breakdown of life expectancy improvements show that the UN has modeled the same ball park value of +0.11 to +0.15 years improvement per year. They roughly assumed USA 1950-2020 observed LE improvement schedule repeated over the entire world.
3. Bayesian probabilistic intervals are so wide as to be useless.
“There’s a 90% chance this country’s population will be between 50 and 110 million in 2100.” These sorts of predictions have little actual value. That is a 100% swing in population. No one could plan for both scenarios simultaneously. If the UN were to engage in scientific rigor, they would do their best to ensure maximum accuracy at 40 years and openly admit high uncertainty past that point.
4. UN Medium is the primary scenario. TFR adjustments are 0.5 offsets instead of parameterized curve functions.
From the official “Definition of Projection Scenarios” page:
“Low fertility scenario: Differs from the medium scenario only in the projected level of total fertility. Total fertility is projected to remain 0.5 births below the total fertility in the medium scenario.”
“The high, low, constant-fertility and instant-replacement scenarios differ from the medium scenario only in the projected level of total fertility. In the high scenario, total fertility is projected to reach a fertility level that is 0.5 births above the total fertility in the medium scenario. In the low scenario, total fertility is projected to remain 0.5 births below the total fertility in the medium scenario.”
“World Population Prospects 2024: Methodology of the United Nations Population Estimates and Projections” (PDF, section II.F, pages 53-55; direct link: https://population.un.org/wpp/assets/Files/WPP2024_Methodology-Report_Final.pdf):
The low variant applies the -0.5 offset with a gradual transition for smoothness:
0.25 births lower (2024-2028)
0.4 births lower (2029-2033)
full 0.5 births lower from 2034 onward
Life Expectancy Improvements
The CIA team took a deep dive into the Life Tables for projected LE improvements post 2023. The results showed a shocking level of optimistic assumptions.
The UN essentially applied a homogenized historical US improvement schedule globally:
Observed Annual LE Improvement Rates (UN Projections 2024-2100):
Africa: 0.139 - 0.147 yr/yr
Asia: 0.122 - 0.149 yr/yr
Europe: 0.119 - 0.150 yr/yr
Latin America: 0.119 - 0.157 yr/yr
N. America: 0.115 - 0.140 yr/yr
Oceania: 0.092 - 0.098 yr/yr
US historical 1950-2020: ~0.13 yr/yr
The problems with this approach:
1. USA 1950-2020 conditions were unique:
Post-war industrial base already established
Antibiotics newly available
Massive infrastructure in place
Stable governance
2. Africa cannot replicate this because:
Infrastructure must be built, not maintained
Physician density 15-20x lower than required
Climate change impacts concentrated there
Governance challenges ongoing
3. This is modeling failure:
Extrapolating developed-world trajectories onto structurally different contexts
Assuming technology linearly improves into the future.
Immigration
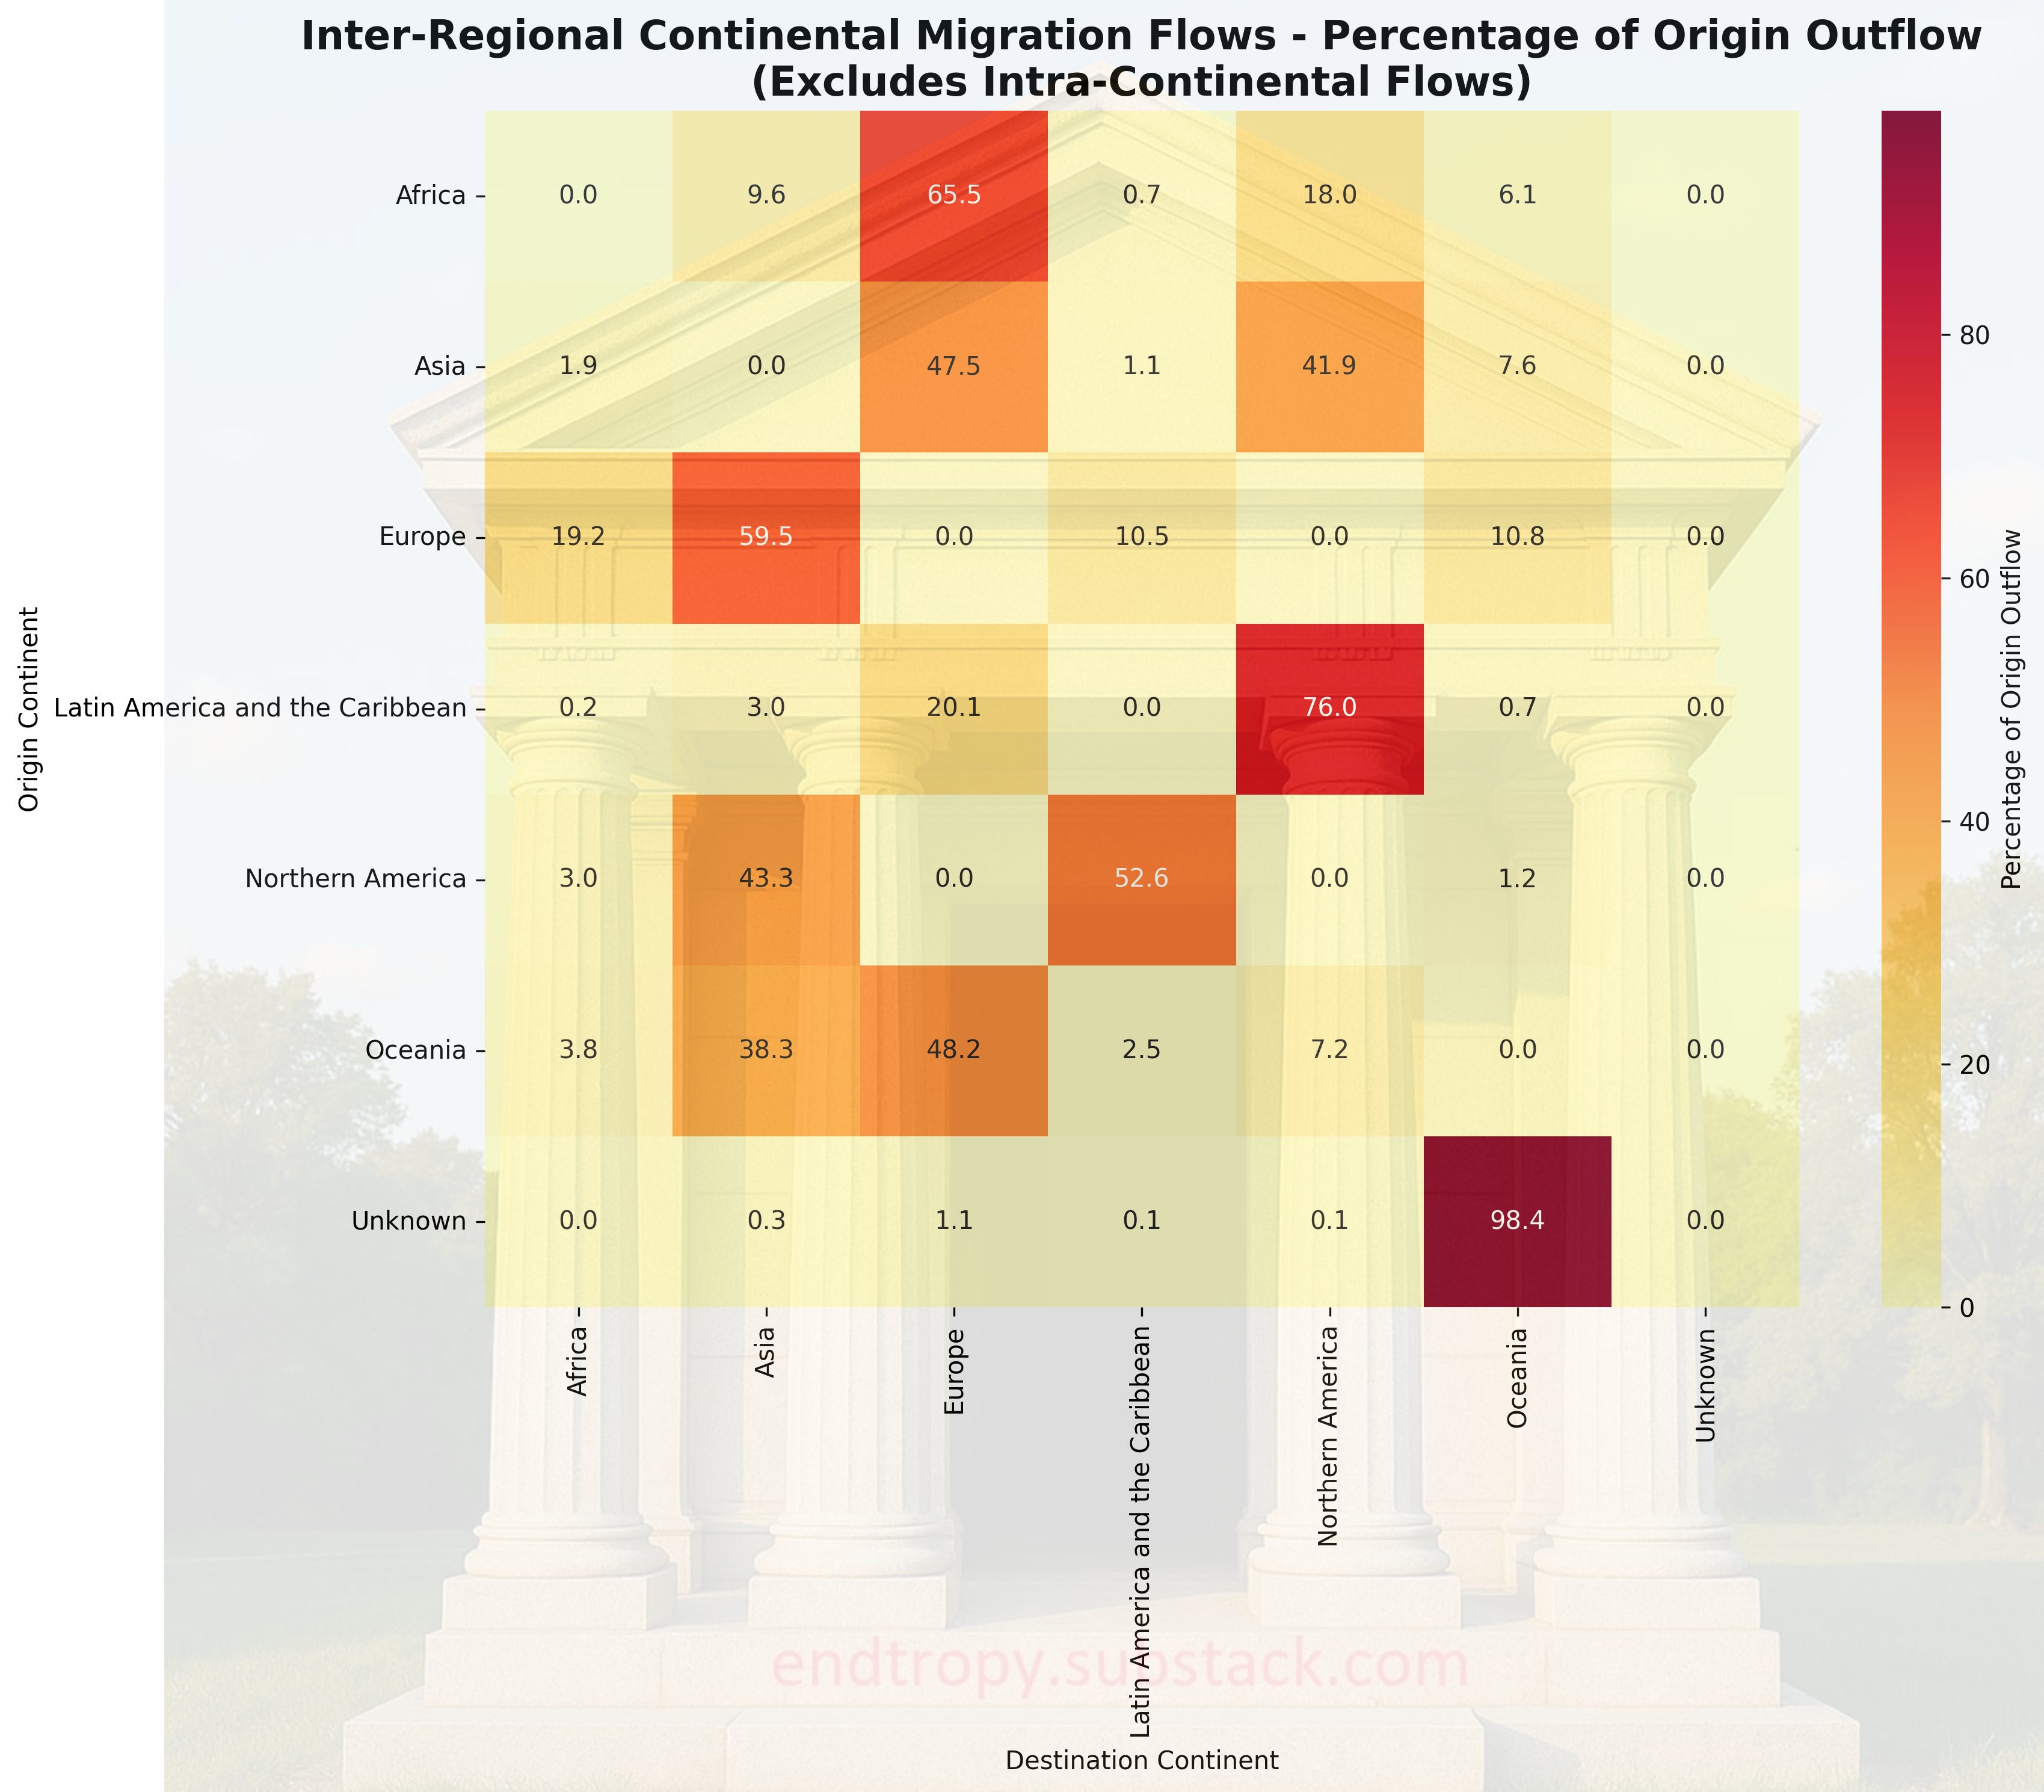
The model does not incorporate migration into its forecasts. These are mainly psychological phenomena rooted in perceived economic opportunities and ease of immigration. An attempt was made to improve the model’s accuracy by determining “conductance patterns” between regions. It’s clear that only a few regions can be considered premier attractors of human capital. Europe and North America are the primary attractors with Asia coming in third.
Any observed precipitous decline in a nations population curve of the CIA model can be expected to be mitigated by immigration. Inaccuracies simply reflect inter-regional movement. Note: “Unknown” indicates various microstates in Oceania. Hence, the majority of those nations moving to Oceania.
“World” would have net migration equal zero. Since we cannot move off planet, the sum of human immigrants must be the sum of total emigrants from source regions.
The model’s “World” population curve should be accurate as a basis for future predictions understanding that net migration is zero. We can thus infer that high TFR regions will account for the CIA population model’s inaccuracy in the past and the future.
Migration patterns are also conducive to skewing the TFR of a host country sharply upwards. This has the effect of appearing like a TFR rebound is happening. Immigrant populations always have more children than native born. However, this reverses and the TFR becomes the same as the host country within 3 generations.
Immigrant TFR Convergence
United States
Studies on Hispanic (especially Mexican-origin) women show progressive declines across generations. First-generation TFR is elevated, second-generation approaches native levels, and third-generation often matches or is very close to non-Hispanic white TFR (around 1.7–1.8). Recent data indicate overall immigrant TFR has declined sharply (from ~2.75 in 2008 to closer to native levels by 2019), narrowing differentials.
Europe (e.g., France, UK, Norway, Germany)
Second-generation fertility generally converges toward native norms, with sociocultural distance (origin country characteristics) explaining remaining variations. For instance, descendants of Maghrebian immigrants in France show strong convergence, sometimes even below native levels. In the UK, intergenerational adaptation from high-fertility origins drives convergence, contributing to overall ethnic fertility alignment. Norwegian data reveal decreases from first to second generation.
Nuances and Exceptions
Convergence is not universal or immediate — Some groups (e.g., certain religious or cultural minorities) retain modestly higher fertility longer due to persistent norms. Mixed-parentage (2.5 generation) cases sometimes show incomplete alignment.
Tempo effects (e.g., delayed childbearing post-migration) can temporarily inflate or depress first-generation TFR, but cohort/completed fertility measures confirm long-term adaptation.
CONCLUSION:
Immigration is a temporary solution. It does not change TFR trajectory and therefore population trajectory. Within 3 generation if you stop immigration from happening, the region’s population will be “native” level. And that may result in a region exhibiting downward population pressure. This means a region with strongly negative TFR must continue allowing mass immigration to maintain population.
The CIA Hypothesis
The UN, through complexity and speculative assumptions, created a forecasting engine that is inaccurate. They abandoned their previous methodology. The CIA implemented the methodology from the UN’s own past population projection updates. This engine was implemented and then backtested to ensure confidence. The demographic projection engine has properly aging cohorts and a number of special features.
The basic engine is a common cohort projection engine described via numerous academic papers. You can see all previous graphs are subtitled 1.4 TFR FLOOR; one of the special features aimed at testing different variables relevant to demographic forecasting.
The curves that you see above with a 1.4 TFR FLOOR are an unrealistic rebound, specifically to demonstrate that the even the UN LOW forecast is highly unlikely.
With a 1.4 TFR FLOOR, the model achieves near equal values and shape as the UN LOW curve. This is impossible. Eastern Asian economies, many European countries and other regions are provably below this level.
The 1.4 TFR FLOOR setting gives a massive boost to fertility to nations like Taiwan, South Korea and Japan that are well below 1.0 TFR. South Korea’s TFR is 0.7 – 0.8; the testing scenario gave it a boost immediately to 1.4 TFR starting in 2023, and yet, the CIA curve is matching UN LOW.
This would be every couple in SK having 1 more child immediately. Over 50% of countries globally are currently below replacement-level fertility. These countries encompass around 67% of the world’s population. The implications are enormous and must be studied.
We used the exact same Life Tables for all demographic projections. There will be a special supplement later once we apply 0.8 TFR floors to show what would happen if we were to halve the LE improvements to more accurately reflect a saturation curve of improvement.
The Most Critical Methodological Flaw: Data Integrity
The UN does not perform ground-level data collection. They are not out there counting heads.
The UN Population Division (UNPD) acts as a data aggregator and harmonizer, not a primary surveyor. This distinction is the root of massive academic controversy and creates a significant margin for error, particularly in the developing world.
Harmonization, Not Collection
When the UN releases its “World Population Prospects” (WPP), they are relying on three tiers of data quality, none of which they generate themselves.
The UN relies exclusively on national statistical offices (e.g., US Census Bureau, Nigeria’s National Bureau of Statistics, China’s National Bureau of Statistics). They take what governments give them.
If data is good: They generally accept the official census data but apply “smoothing” algorithms (The Cohort Component Method) to fix obvious anomalies (e.g., if a census claims zero mortality in a specific age bracket, the UN math corrects it).
If data is patchy (The Dangerous Part): For countries that haven’t had a census in decades (like Afghanistan or DRC) or have unreliable registries, the UN fills the gaps using small-scale sample surveys.
Demographic and Health Surveys (DHS): USAID-funded household surveys.
MICS: UNICEF surveys.
They extrapolate national totals from these samples.
The UN has political constraints. They generally cannot accuse a member state of lying. If a nation publishes falsified census data for internal political reasons (to secure tax revenue or voting representation), the UN essentially has to “model around” the lie, often resulting in inflated numbers.
Who is Questioning the UN?
In the last five years, a “Demographic Revisionist” movement has emerged in academia arguing that the UN is systematically overestimating global population by assuming fertility rates will stay higher for longer.
The Institute for Health Metrics and Evaluation (IHME) / The Lancet Study
This is the most significant rival to the UN. In 2020, The Lancet published IHME research that fundamentally disagreed with the UN.
The UN projected a peak of 10.9 billion around 2100. IHME projected a peak of 9.7 billion in 2064, followed by a steep crash to 8.8 billion by 2100.
IHME argued the UN fails to properly model how fast women’s education reduces fertility. They claim the UN assumes fertility declines slowly, whereas real-world data (Korea, China, Thailand) shows fertility collapses vertically once industrialization hits.
Yi Fuxian (University of Wisconsin-Madison) & China
Dr. Yi Fuxian is the primary whistleblower on Chinese population data.
He argues the Chinese Communist Party (CCP) systematically overcounted their population by 100–130 million people.
Local officials inflated birth numbers to get subsidies, and the central government maintained high numbers to project geopolitical strength.
For years, the UN accepted Chinese official data. If Yi is right, the UN’s baseline for the world’s second-largest country is off by the size of Mexico. In recent years, the UN has begun downwardly revising China, quietly admitting Yi may have been right.
Other niche analysts goes to so far to say that China’s current population is under 1B.
The “Nigeria Bubble” Critique
Much of the UN’s future growth comes from Sub-Saharan Africa, specifically Nigeria (predicted to become the 3rd largest nation).
Researchers like Jesus Felipe and other development economists have noted that Nigeria’s census figures are politically weaponized (North vs. South revenue sharing).
When relying on satellite imagery (counting rooftops) and sewage treatment outflow data, the physical footprint often doesn’t match the reported human density, suggesting the baseline is inflated.
Africa in every demographic forecast is the only reliably growing region. If the data integrity is wrong, we are facing a colossal shortfall of human labor and consumption. These exact imaginary humans are what the economists think will counterweight the West’s demographic decline.
Academic consensus is shifting toward the view that the UN is consistently overestimating the speed of population growth because they are too slow to recognize the speed of fertility collapse in the developing world.
The “Peak Human” moment is likely coming sooner than the UN reports.
CIA BRIEF
The UN is operating in a mathematical delusion. They are narrative assuagers not impartial scientists. The narrative is continued growth. The UN reinforces this the same way a mother soothes her crying baby. Consider the state of all forward future projections if we begin calculating the effects of pensions withdrawals in contrast to the working population. This is a small taste of what the CIA will explore.
The CIA population engine FORCES an immediate boost to 1.4 TFR. As explained this would lead to South Korea doubling its current TFR; an immediate plus 1 child per male/woman pairing. And in every single continental region, the predicted population curve is less than the UN Medium scenario.
Immigration cannot solve this. We can already see proof that within 3 generations, immigrants have the same TFR profile as their host countries. The Western world has been treating immigrants like an infinitely replenishing resource. But even these source countries are undergoing their own drop in TFR.
A large scale data collection effort must be funded to find the true population numbers. If we are trying to plan the future, data integrity is the utmost importance.
THE WORLD IS SLEEPWALKING
TOWARDS A DEMOGRAPHIC CLIFF
The next several CIA dispatches will explore:
Why UN Low scenario is far more likely than their Medium.
How the CIA population engine’s accuracy compares to other academic models.
Critical analysis of geopolitical players viewed from the lens of demographic strength or weakness.
The role of the United States Dollar and the current fiat monetary regime in a demographic decline.
The negative effects of declining population of immigrant source countries on the world economy.
The negative effects of declining population of Western countries on the world economy.
Peak G
Some of these dispatches will be locked as Tier 2 intelligence and not part of the public record.
The CIA is not engaging in opinion.
We are providing the results of an analytical pipeline with globally disruptive outcomes.
This is not a “newsletter.”
NEXT

Excellent work, thank you! As governments continuously increase the stress level on their populations, reproduction rate as well as longevity decline. No hay otra camino!
You are absolutely right. I am twenty right now and not one of my friends (married or not) want children. Me neither but i am the youngest of my friend and single lol