
The CIA Demographic Engine
Plato's Cave of Demographic Illusions

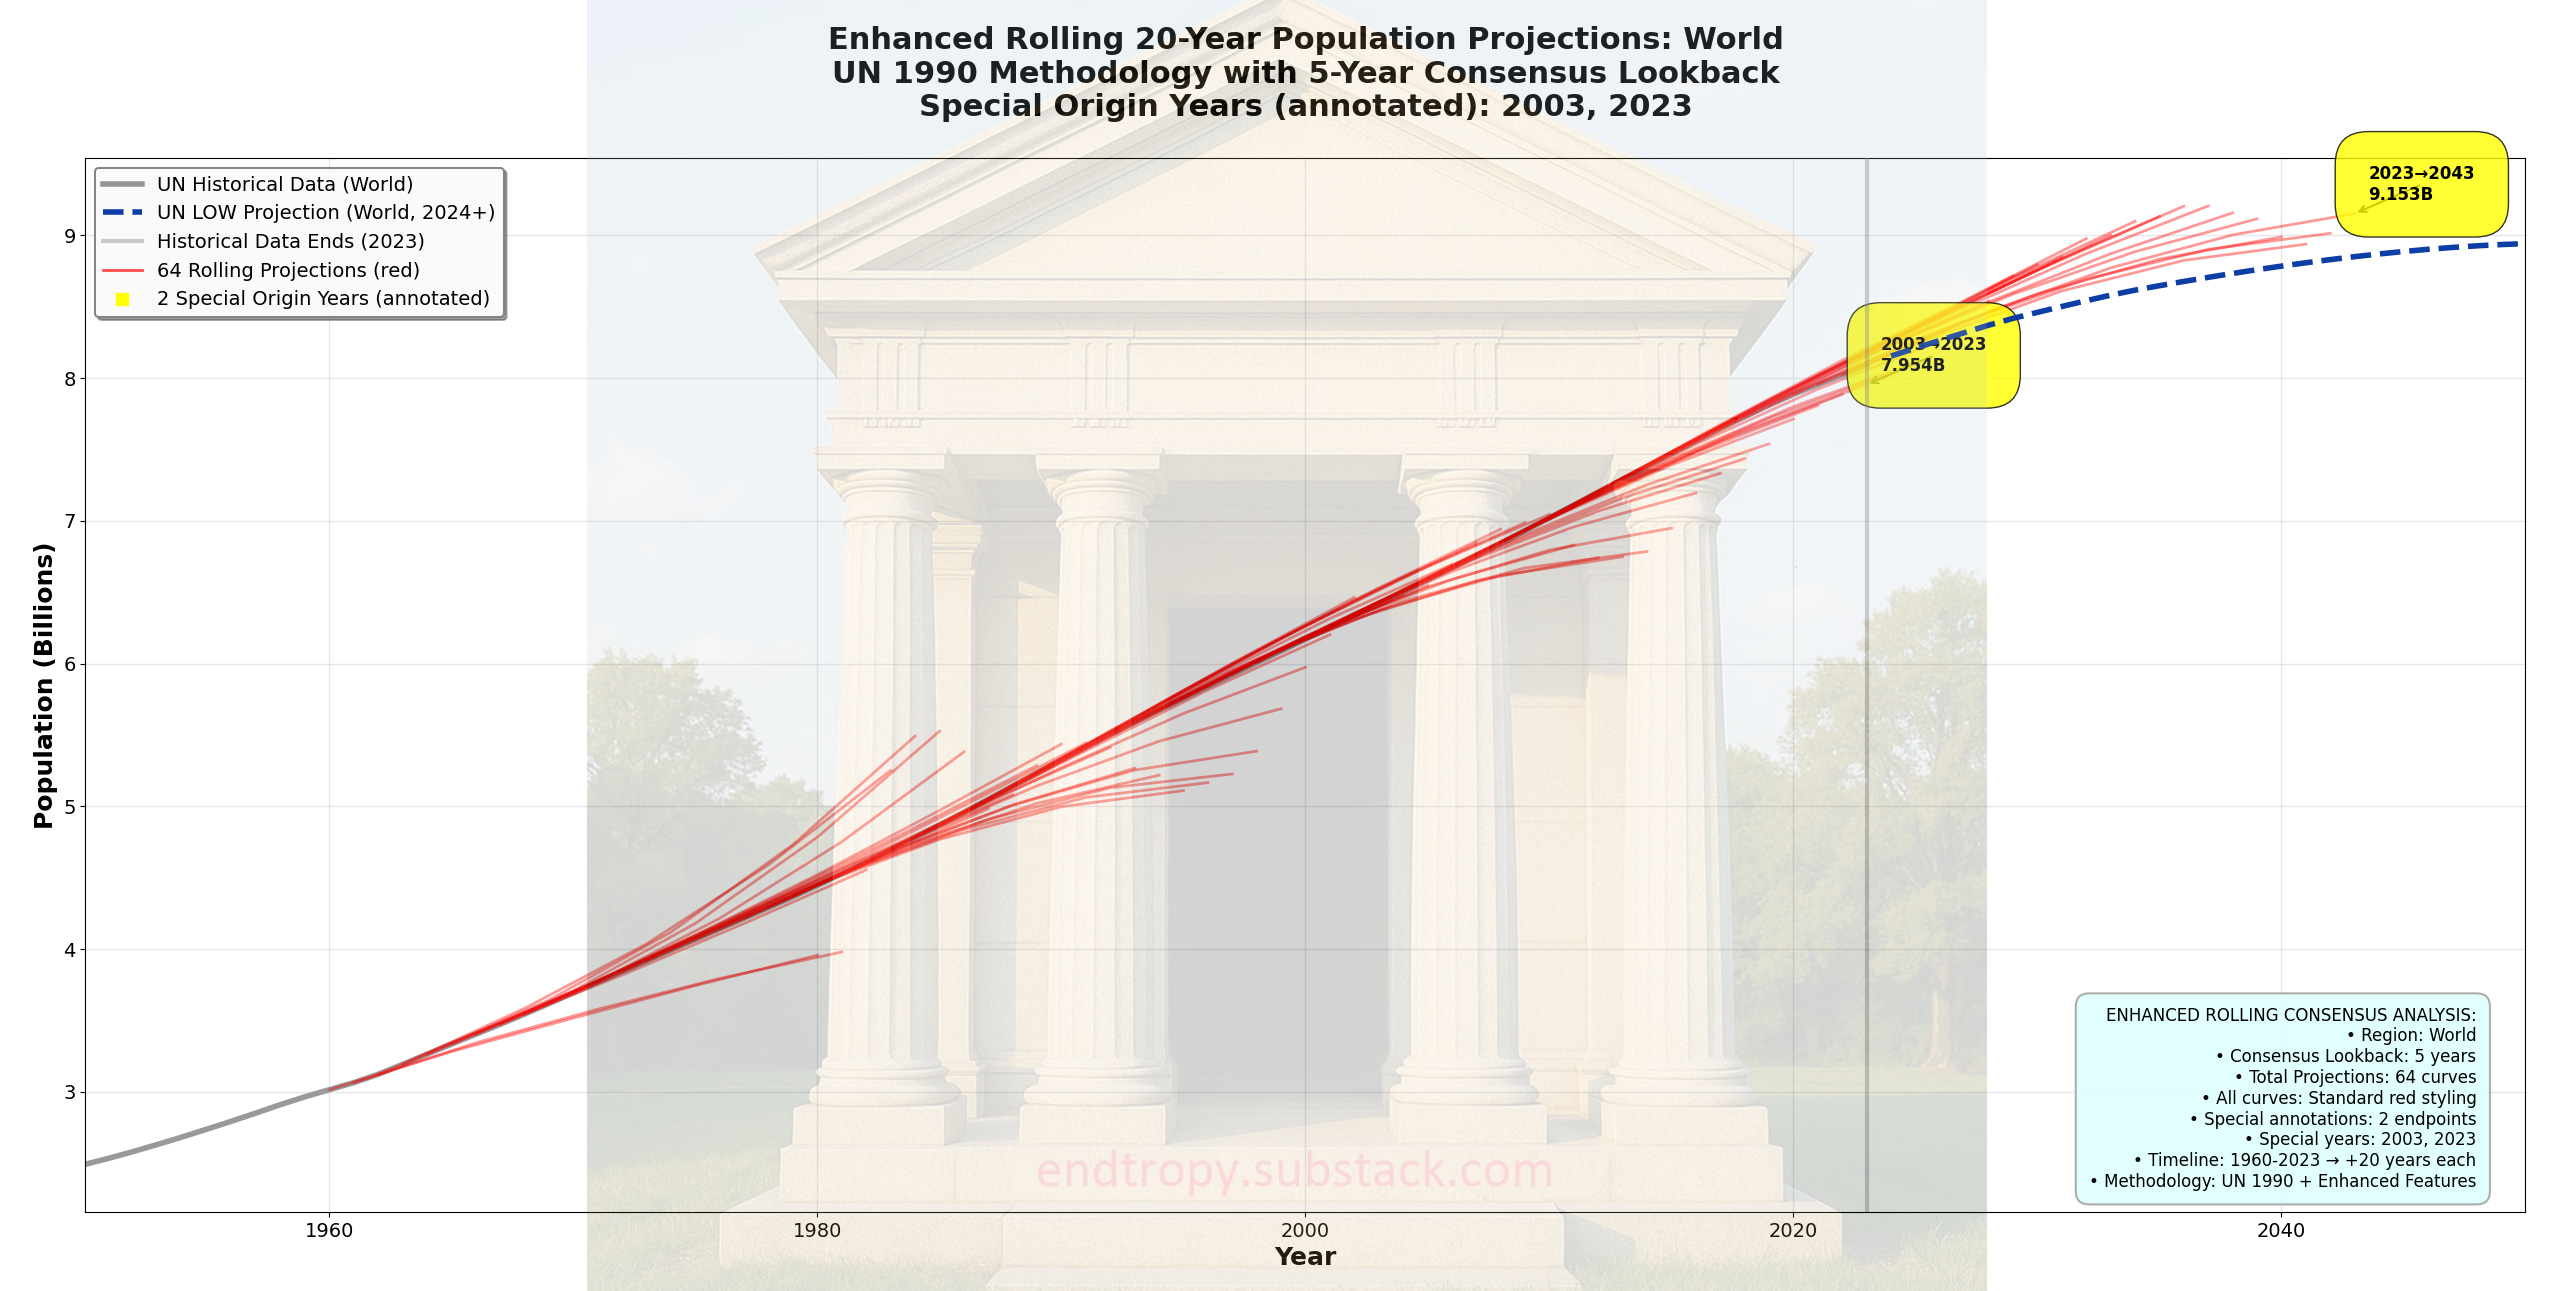
This graph is a rolling back test with the WORLD population curve, using CIA’s best parameters for the WORLD curve. The demographic engine has been back tested with 10 lookback parameters and rolling 10, 20, 40 year periods, optimization required 1,220 individual runs repeated per country, sub region and macro region; with 300 regions optimized for, much like quantitative finance methodology.
This is a trend following predictive engine. These are known in academia as being reliable over the 20 year time period with poor accuracy going out to 40 years.
Per country or region we run the optimization by using X number of lookback years from 1960. 1 – 10 lookback years since the UN population cohort data goes back to 1950. Using the lookback years, we can define a TFR trend. We use this to run rolling projections up to the current UN data of 2023.
For example the WORLD region, using lookback years is tested at 1960, 1961, 1962, 1963 and so on. With a rolling 10, 20, 40 year population prediction number measured against the actual population of that year.
If 1960….
X number of years lookback sets TFR trend
roll forward all cohorts, with births, deaths and a conservative mortality improvement
in 1970, we record the engine’s predicted population
in 1980, we record the engine’s predicted population
in 2000, we record the engine’s predicted population
This process must be repeated for every lookback period setting the TFR trend and at all time points that allow extrapolation to future actual population. The 40 year forward prediction can only be run from 1983 to 2023 for example.
You can observe that the engine in 2003, predicted the 20 year forward world population would be 7.954B, with the actual figure being 8.091B. Thus achieving an error of 1.9% from a 20 year prediction.
The 2043 prediction is 9.06B, higher than UN LOW but lower than UN MED. This was not intentional but merely a reflection of the design choices of the engine. This picture only displays the one forward projection run of the winning parameters, not the 1 220 referenced earlier.
Examining the optimization and accuracy graph, we can see that the engine is picking up the slowdown in TFR as an indicator of the general direction of the world already by the 1960s. These linearly extrapolated trends showed the decline rate forcing lower actual population numbers.
The UN was far more successful in their models since they were not locking in TFR trends. They assumed slow anchoring to 2.1 TFR. This was correct since high birth rates in any species eventually moderates. However, recent trends in TFR have made the UN realize their assumptions are too static and conservative. The previous dispatch reported that UN2017 showed a 11B population by 2100. Which was then revised downward to 10B by 2080 in UN2023.
All assumptions moving forward will work from the 0.8 TFR FLOOR population curves. Accuracy for the WORLD only graph was +/- 10% error at 81% CI. This is a respectable accuracy.
What TFR is actually demonstrating is the sum effect of all environmental factors. If such factors are favorable, we can generally assume a healthy TFR at replacement or higher values. The opposite must also be true. Demographers are trapped in Plato’s Cave without realizing. We can study other animal species and observe population pressures. Humans are no different. Surplus resources mean population growth. Resource limits mean reduction in population.
TFR is a derivative observational metric of fundamental drivers. Without a proper accounting of all the factors that can push populations in either direction, we are no better than watching shadows on a wall.
The main takeaway is that the CIA engine, UN projections and nearly every single demographic engine is wrong. Humans scientists are trying to determine the population curve on a species with mathematical precision and abstraction.
So we ask the reader: What is your mental landscape for the next century? A time of plenty or a time of limits?
The specific rationale for developing this demographic engine was the added functions such as TFR floors and some other undisclosed parameters which will be discussed in a future dispatch.
This is the first mention of the Trifecta Cascade as a tested parameter.
This will invalidate every single model of demographic projection. What graphs you have seen so far follow the mathematical premise. But there is a structural force approaching that will become the single dominant factor in political discussion in the 2030-2040 time period.
This will cause a permanent phase change in the population curve forever.
CIA BRIEF
-We have built a demographic engine with more tunable parameters.
-These parameters go beyond mathematical tuning from an identification of a PHASE CHANGE variable being unnoticed by mainstream analysis.
-We have incorporated fundamental drivers of population change into prediction for the post 2023 period.
-The identified Trifecta Cascade will determine the course of human history.
PREVIOUS

NEXT

«But there is a structural force approaching that will become the single dominant factor in political discussion in the 2030-2040 time period.
This will cause a permanent phase change in the population curve forever.»
Could the phase change be a combination of low fertility + aging + (?)?
(?) = Resource scarcity?
(?) = The fall of the dollar?
(?) = The end of the capitalist system?
(?) = Limited-range nuclear wars???!!!