
Optimal Zero Sum Game Theory: The American Century


CRITICAL:
The Venezuelan Oil Saga is a series of interlinked analysis on the current situation. Please read all the linked dispatches at the bottom of this page. You will be missing critical background, nuance and math data.
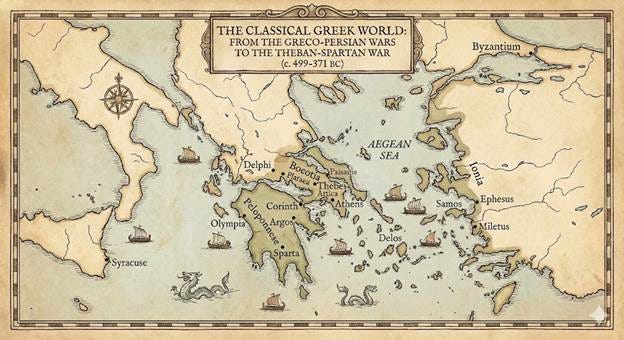
480 BCE – Thermopylae
Leonidas and the Hippeis stand at the ready.
They know the duty of every Spartan soldier.
On their shield.
Or with their shield.
A defeat here means the rest of Greece at their backs cannot mobilize and evacuate citizenry.
Furthermore, it would expose the flank of the Greek Navy.
The Spartans and their allies held for 3 days.
They die a glorious death.
Greek Freedom and Democracy survives.
Then the Greeks got bored of peace…
Here’s what really happened after the defeat of the Persians:
The Greeks went back to fighting each other.
Sometimes allying WITH the Persians against other Greeks.
460 BCE - 1st Peloponnesian War
Sparta vacated the position of command over the Hellenes shortly after cessation of Persian hostilities.
Athens became much stronger and began asserting its imperialism against smaller city states.
Ended in a negotiated truce only because Athens was defeated in an Egyptian campaign.
431 BCE - 2nd Peloponnesian War
A series of cascading events with interlocked alliances forced Athens and Sparta to war.
Eventually led to large battle with Athens losing in Sicily.
Athens recovers and begins to become a naval power capable of engaging the Persians in the Aegean Sea.
Persia enters the conflict supporting the Spartans.
Spartan victory over Athens. They become too powerful.
The Athenian navy and might destroyed, Sparta’s land force became the dominant Greek power.
390 BCE - Corinthian War
Dissatisfaction grew with Sparta as the ruling power; inequal loot distribution from the previous war and military oppression.
Sparta is campaigning actively against Persia in Asian Minor but must turn back due to bribery of mainland Greeks by the Persians. The Spartans had made good ground.
Thebes instigates a general rebellion of smaller city states against Sparta.
Persians ally with the mainland Greeks against Sparta.
But Athens’ supported the sitting king of Egypt which was at war against Persia.
Persia began aggressively posturing that they would be willing to switch sides to support the Spartans instead.
This occurred late in the war, it forced a close to hostilities.
378 BCE - Theban-Sparta War
A Theban coup overthrew the Spartan leadership.
Theban hegemony is achieved after numerous back and forth battles.
Athens and Sparta now allied since the Thebans grew too powerful.
Persia watches this and decides, yes, Thebes is too powerful. They provide monetary aid for supporting Sparta.
A final pitched battle between Thebes and Sparta ended up an effective stalemate with a negotiated treaty. Both parties being so weak that Macedon would rise in the power vacuum.
From 480 BCE to 380 BCE, there were 5 major wars. Many smaller regional conflicts not mentioned.
9 Persian Kings lived to watch the madness in Greece.
Conditional Convenience
Friend vs Foe
Ally vs Enemy
Us vs Them
These seem to be such simple boundary definitions. But we can see in history and in present, power politics has no honor code.
The future will be no different.
One day, you fight with someone shoulder to shoulder. The next, he’s on the other side of the field.
The Hollywood version of 300 ended on a united Greece. It didn’t last for long.
Simplistic black and white narratives never last.
The CIA performs observational analysis without any moral outrage.
Our mission statement is without judgement.
This is our predictive edge.
Clueless in Canada
The Liberals are one of the most Green aligned federal governments any where on the planet.
They have repeatedly refused to fully develop carbon based natural resources for over 10 years.
The knock on effect resulted in not establishing secondary markets and relying heavily upon US demand. This is going to end terribly and become a vise in the US’ favor.
Canada is currently oblivious to the danger it’s in. They are living life like a Sunday stroll.
Not realizing they are already too late boarding the bus.
This is a very long dispatch. You’ll need at least 1 hour.
And if you’re Canadian, you’ll need the entire day because of the mental depression.
This is the Capstone of the Venezuelan Oil Saga.
Oil Export Options
Can Canada Pivot to China?
The answer is: China wants to, Alberta wants to, but Ottawa made it illegal.
To “pivot” fully to China, Canada would need TMX2.
TMX-TRANS MOUNTAIN EXPANSION
· nominal capacity of ~890,000 bpd.
· As of late 2025/2026, it is operationally Full.
· It isn’t just shipping heavy oil for China. It flows to:
1. Puget Sound Refineries (Washington State): Structural dependency for US refineries.
2. California: Replacing declining Alaskan North Slope and lost OPEC heavy oil.
3. Asia (China/India): The leftovers.
China is already taking as much as they can bid for, approx 200 000 bpd average. There is no “Surge Capacity” left in the steel pipe. It runs at nameplate capacity. Remaining volumes are contractually spoken for. Average utilization is around 90% per operating quarter.
Canada’s self-inflicted strangulation
The Trans Mountain Expansion (TMX) is legal because Bill C-48 only banned tankers on the North Coast of British Columbia.
TMX terminates on the South Coast (Vancouver).
The Line on the Map (North vs. South)
Bill C-48 (The Oil Tanker Moratorium Act) bans crude oil tankers from docking, loading, or unloading at ports North of 50°53’ N latitude (roughly the northern tip of Vancouver Island up to the Alaska border).
· Prohibited Zone: Prince Rupert, Kitimat. (Deep water, close to Asia, uncrowded).
· Allowed Zone: Vancouver/Burnaby. (Shallow water, furthest from Asia, incredibly crowded).
If Canada wanted to save its economy and supply China properly, the logical move is to send oil by Rail or Pipe to Prince Rupert (North Coast). It is days closer to China by ship.
Bill C-48 makes this specific logical route illegal.
The TMX/Vancouver Problem - The “Garden Hose” Port
TMX offloads at the Westridge Marine Terminal in Burnaby (inside Vancouver harbor). Because TMX is forced into this southern port, it faces physical limitations that destroy efficiency:
· Vancouver’s harbor is too shallow and the bridges are too low. It cannot handle Very Large Crude Carriers (VLCCs), which carry 2 million barrels.
· TMX is restricted to Aframax tankers (carry ~550k–600k barrels).
· To move 1.2 million barrels to China, you need 2 ships from Vancouver vs. 1 ship from a deep-water port. This doubles the shipping traffic and increases the transport cost per barrel. And GHG emissions.
Rail-to-Sea: Illegal or Uneconomic
Geographically, this makes sense (Rail from Alberta to Prince Rupert is shorter than to Texas).
Legally and Economically, it is impossible due to Canada’s Self-Embargo.
Bill C-48: The Oil Tanker Moratorium Act explicitly bans oil tankers carrying crude (including bitumen) from loading at ports along British Columbia’s north coast.
Plan A: Rail crude to Prince Rupert (North).
Logistics: Excellent. High-capacity rail exists. Deep water exists.
Law: Illegal. Bill C-48 prevents the ship from loading the crude once the train arrives
The Geography (Vancouver): This leaves Vancouver as the only legal rail-to-water terminal.
Plan B: Rail crude to Vancouver (South).
Logistics: Nightmare. The train must travel through the treacherous Fraser Canyon (prone to washouts/fires). Vancouver rail lines are congested with grain and potash.
Law: Legal, but functionally capped by congestion and high cost.
The Cost: Rail adds $15 - $20 USD/barrel to transport costs compared to pipelines $5 - $10. Canadian producer will need to eat this cost or hope the price of oil rises high enough to offset it.
Bill C-69 - The “No More Pipelines” Bill: This revamped the impact assessment process. Industry consensus is that under this legislation, no major cross-provincial oil pipeline will ever be approved again. The regulatory hurdles are now effectively insurmountable for a 10-year, multi-billion dollar capital project.
Conclusion for the China Trap
China is forced to buy Canadian asphalt feedstock (Dilbit) out of a “drinking straw” (Vancouver/Aframaxes) because Canada cemented shut the “fire hose” (Prince Rupert/VLCCs).
The Geostrategic Veto
If Alberta and China decided to ignore Ottawa and push a massive infrastructure project (Chinese financing for Canadian rail/pipe):
· The US would view significant Chinese control over North American energy infrastructure as a national security threat.
· The US controls the investment capital and trade terms (CUSMA/USMCA) that run the rest of Canada’s economy. The US would likely pressure Ottawa to kill the deal using “National Security Review” (just as they did with Chinese acquisitions of Canadian lithium miners).
We will explore the possibility and timeline of TMX2 much later in the final synthesis.
Conclusion: Alberta is Trapped
The US Military operation in Venezuela is the nightmare scenario for Alberta because Canada has no counter-move.
They cannot build North (Legal Ban).
They cannot build West (Regulatory Hell / TMX is maxed).
They cannot build East (Quebec opposition).
They must send oil South.
China will buy every barrel coming out of the existing TMX pipeline, likely securing “First Rights” contracts. But they cannot fund a new pipeline to save Alberta because Canadian Law currently forbids the infrastructure necessary to load the ships.
Canada successfully embargoed itself before the trade war even started.
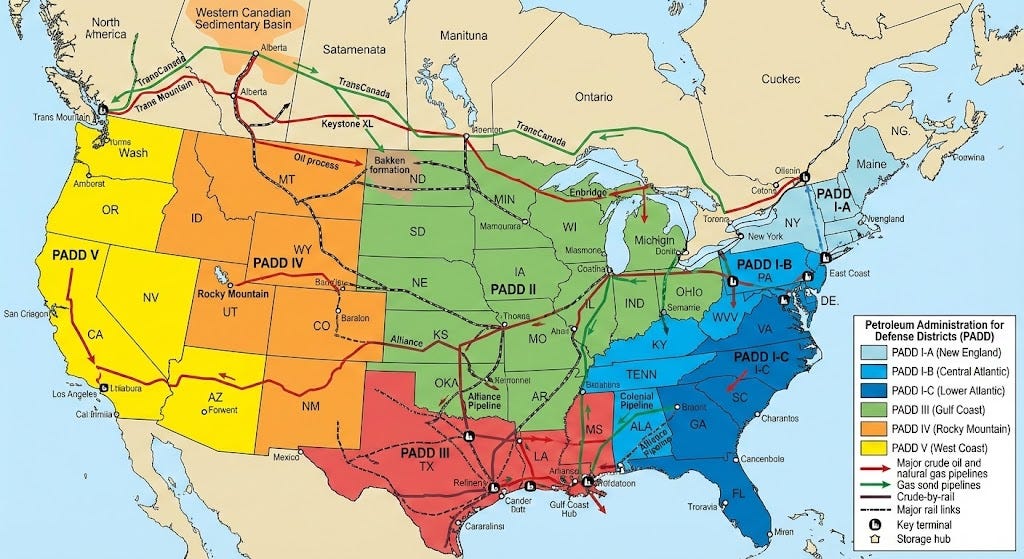
Petroleum Administration for Defense Districts
Canada’s Current Oil Production
As of late 2025 data (projected through 2026), Canada’s crude oil production averaged approximately 5.2 million barrels per day (mbpd), with a record high of 5.44 mbpd in December 2024 and an average of 5.19 mbpd through June 2025.
Exports to US PADD2 and PADD3
Canada’s total crude oil exports averaged ~4.2 mbpd in 2024-2025, with ~97% (~3.5-4.1 mbpd) going to the US.
· PADD2 (Midwest US): Receives ~65-70% of Canadian US exports, or ~3 mbpd (~55-65% of total Canadian exports). This is the largest market due to pipeline access and refinery compatibility with heavy crudes.
· PADD3 (Gulf Coast US): Receives ~20-25% of Canadian US exports, or ~1 mbpd (~17-24% of total Canadian exports). Volumes have grown significantly (505% from 2013-2023) due to pipeline expansions like TMX, but it’s more vulnerable to competition.
PADD was created during WWII to allocate fuel for war. Today, it allocates margin and survival. To understand why the US has geopolitical stranglehold power, and why Canada is structurally trapped, you must understand the interplay between PADD2 (Midwest) and PADD3 (Gulf Coast).
They are distinct industrial organisms with different diets, different vulnerabilities, and different masters.
PADD2: The Captive Midwest
Geographic Core: Illinois, Indiana, Ohio, Oklahoma, North Dakota.
This region is the industrial heartland of North America. It contains the Chicago/Whiting refining cluster (BP) and Cushing, Oklahoma (The WTI pricing hub).
The Canadian Sludge Diet
PADD2 is structurally married to Alberta.
Because it is landlocked (no tankers), it relies entirely on pipelines.
Over the last 20 years, refineries here (specifically BP Whiting and others) underwent massive, expensive retooling to process Canadian Heavy Sour (Tar Sands).
PADD2 imports roughly 3 mbpd from Canada.
It is a Monopsony relationship. Canada must sell to them, and PADD2 must buy from Canada. There are no other large-scale suppliers that can pipe heavy oil there efficiently.
The Physics Buffer
Cushing, OK (in PADD2) acts as the pressure valve for the US oil market.
When PADD2 refineries break or fill up, oil accumulates in Cushing.
When Cushing hits “Tank Tops” (Full), the WTI price collapses because there is physically nowhere to put the oil.
Status Today: PADD2 is operating at near-max utilization (>95%). It has no “surge capacity” to help Canada if flows get rejected elsewhere.
PADD3: The “Global Stomach” (The Gulf Coast)
Geographic Core: Texas, Louisiana coast.
This is the largest and most sophisticated refining complex in human history. It processes over 50% of the United States’ total refining capacity (approx. 9-10 million bpd).
The Everything Diet (But prefers Trash)
PADD3 refineries have the highest Nelson Complexity Indices (NCI) on earth. They possess massive Delayed Cokers.
They are designed to buy the cheapest, dirtiest oil on earth (Venezuelan Merey, Mexican Maya, Canadian WCS), crack it, desulfurize it, and turn it into Premium Diesel and Gasoline for export.
They are located in Texas, next to the Permian Basin (Shale Light Oil), but they don’t really want to process it. It’s like filling up a Ferrari with 87 octane.
PADD3 exports US Light Oil (to Asia/Europe) and imports Foreign Heavy Oil to feed its Cokers.
The Logistics Pivot Point
PADD3 has water access. This is its superpower.
It can receive Tankers from Venezuela, Mexico, or the Middle East.
It can receive Pipelines from PADD2 (Canada flow) or the Permian (Texas flow).
Mercantile Power: PADD3 is the only market with Options. It can pit Canada against Venezuela. It takes the lowest bidder. PADD2 does not have this option; it is stuck with the pipe connection.
The Flow Dynamic
Historically and geographically, oil flows North to South (Canada to PADD2 to PADD3).
1. Step 1: Canadian pipelines fill up the PADD2 refineries first. (The “Chicago/Midwest Sponge”).
2. Step 2: Once PADD2 is full, the excess Canadian oil flows down the main arteries (Seaway Pipeline / Keystone Southern Leg) to PADD3.
3. The Venezuela Intervention: This effectively dams the river at the bottom.
If PADD3 replaces the Canadian “South Flow” with Venezuelan “Ship Flow,” the pipe from PADD2 stops draining.
Fluid dynamics dictate that the pressure builds upstream. PADD2 backs up. Storage fills. Canada chokes.
PADD Summary
· PADD2 is a Logistical Cul-de-Sac. It effectively serves as a massive consumption sink and pass-through for Canadian oil. It has no access to global maritime arbitrage.
· PADD3 is a Global Port. It trades on the world market.
The US Military securing Venezuela is a direct subsidy to the PADD3 Refiners (providing them cheaper, higher-margin feedstock via ship) at the direct expense of the PADD2 Logistics Corridor (devaluing the pipeline flow from Canada).
It strengthens the Coast and sacrifices the Interior/North.
What happens if the US directly imports Venezuelan Orinoco oil?
Inventory Audit - 2026 Status
Venezuelan Orinoco Production: ~900,000 to 1,000,000 bpd.
Caveat: Effectively exportable volume is closer to ~600,000 – 700,000 bpd due to domestic consumption and dilapidated infrastructure.
Canadian Flows to PADD3 (Gulf Coast): ~600,000 to 700,000 bpd.
Canada exports ~4M bpd to the US total.
~3M stays in the Midwest (PADD2).
~700k bpd flows all the way down to Texas/Louisiana (PADD3).
PADD2 acts as a through-node.
Physical Displacement
If the US shunts 0.7 million barrels of Venezuelan Merey into PADD3:
It completely wipes out the Canadian market share in the Gulf.
· Refinery Logic: PADD3 refiners buy the Venezuelan oil because shipping costs $2-$3/bbl via tanker
· Canadian transport costs $15-$20/bbl via rail. This is because PIPELINE transport stops. So we get forced into rail transport. Recall the flow dynamic from Canada to PADD2 to PADD3.
The Logjam: The 700,000 barrels of Canadian oil that used to go to Texas have nowhere to go.
They physically back up into the Midwest (PADD2).
But PADD2 refineries are already running at 97% capacity (Saturated Sponge). They cannot eat the extra 700k barrels.
A physical storage containment breach. Storage at Hardisty (Alberta) and Cushing (Oklahoma) hits tank tops.
Production Shut-Ins: Canada would be forced to physically shut down ~500,000 to 700,000 bpd of production. (Roughly 10–15% of total national output). Max capacity is reached in 4-6 weeks. Then shut in is required.
Direct Import Summary: The Canadian Heart Attack
If Orinoco flows to Texas, Canada faces an immediate Economic Cardiac Arrest.
It is forced to slash production (killing jobs) AND sell the remaining oil for pennies (killing revenue), while its currency collapses (killing purchasing power).
This validates why Ottawa would be “trapped” into playing ball with China if they offered a lifeline, because the US “Energy Win” is a Canadian “Energy Funeral.”
Math Crime – Diluent vs Raw Bitumen
The crime comes down to two specific accounting variables that differ depending on which government agency’s report you are looking at:
1. Diluent: Do you count the imported Naphtha inside the export barrel?
2. Destinations: Are we counting Total Global Exports (Canada to World) or Pipeline Exports (Canada to US)?
The Discrepancy Explained: “Dry” vs. “Wet” Barrels
Production Number: Canada produces ~3.5 to 3.8 million barrels of Raw Bitumen/Heavy per day. (This explains the lower range figures).
Export Number (”Wet” Dilbit): To move that bitumen, Canada adds ~30% Condensate. This swells the physical export volume.
The Check: If Canada extracts 3.5M barrels of sludge, it actually pumps ~4.5M barrels of “Product” down the pipe.
Exports to US: Historically averaged ~3.7 – 3.8 Million bpd (Crude + Dilbit).
The Correct Number for the “Financial Hit”
You must use the Total US-Bound Liquid Export Volume, because the price discount ($40 spread) applies to every barrel of sludge AND the diluent mixed into it. When WCS crashes, the “diluent” portion inside the barrel also effectively sells at a distress discount relative to its purchase price.
The Number: 4 Million BPD for simple rounding
· Why TMX doesn’t fix this: Even if TMX sends ~0.5M to Asia, those barrels escape the US trap. But the remaining 3.3M barrels stuck in the US market are the ones suffering the “Heart Attack” pricing.
Economic Impact: The “WCS Blowout”
When storage hits capacity, pricing power collapses. This scenario triggers a WCS (Western Canadian Select) Differential Super-Blowout.
· Normal Spread: $15 - $18 discount to WTI.
· Crisis Spread: $30 - $40 discount. (Canadian oil sells for ~$20-$30/barrel while WTI is $60USD).
The Financial Damage:
1. Revenue Loss: At a $40 spread, Canada loses approximately $100 million USD per day. Annualized at $36.5 billion loss.
2. Currency Crash: The Canadian Dollar (Loonie) is a petro-currency. Losing ~10% of total export value likely pushes the CAD to $0.6 range against the USD.
3. Inflation: Everything Canada imports (food, tech) costs 10% - 15% more overnight as the exchange drops from $0.7 to $0.6.
4. Government Insolvency: Alberta relies on oil royalties for ~30-40% of its budget. This scenario effectively bankrupts the province. The Federal government loses massive tax receipts, exploding the deficit.
The “Distress” Premium - Why it hits $40
Transport cost covers the physical movement ($20). This is because PIPELINE transport stops. So we get forced into rail transport. Normal pipeline cost per barrel is only $10. Recall the oil flow from Canada to PADD2 to PADD3.
But the “Crisis Spread” includes the Storage Panic Discount.
This is historically validated by the 2018 WCS-WESTERN CANADIAN SELECT Blowout.
· In late 2018, inventories in Alberta exceeded takeaway capacity. Storage hit “tank tops.”
· The WCS-WTI differential blew out to $50 USD/bbl.
· Why….
Quality: ~$10 (Heavy/Sour penalty).
Transport: ~$20 (Cost of Rail).
Panic: ~$20. Producers had to practically give the oil away because if they didn’t sell it, they would have to shut in production (which costs millions to restart). Traders bought it for pennies because they were the only ones with storage space.
If PADD3 buys Venezuelan oil (removing ~500k-700k bpd of demand from Canada), the backlog in Canada will exceed 2018 levels. Therefore, predicting a $30 - $40 spread is actually conservative compared to the $50 spread seen in 2018.
Does a price crash only affect the distressed barrels, or does it infect the safe barrels?
Loss calculation applies to the Total Export Volume (roughly 3.8 – 4.0 million bpd), not just the 700,000 displaced barrels, is due to the mechanism of Hub-Based Index Pricing.
In commodity markets, the Marginal Barrel sets the Clearing Price for everyone.
The Pricing Hub: Hardisty, Alberta
Canadian heavy oil is generally priced at a central hub in Hardisty. This creates a benchmark price called “WCS Hardisty.”
· Price is determined by what buyers are willing to pay at that specific location to take the oil away.
· Every day, producers bid to put their oil into a pipeline. If there is more oil than pipe space, the price drops until it becomes profitable to use the next transport option Rail.
The Mechanism of Infection
Imagine PADD2 (Chicago) continues to buy its standard 3.3 million barrels. PADD3 (Texas) stops buying its 700,000 barrels.
· You now have 700,000 barrels sitting in tanks in Alberta with no pipe to go to.
· To sell that “Homeless” 700k barrels, the producers must lower the price until it makes sense to put it on a Railcar (Cost: $20/bbl). This smashes the WCS Hardisty Benchmark down by roughly $20.
· The buyers in PADD2 (BP Whiting, etc.) have contracts that usually say: “We will buy your oil at WTI minus the WCS Differential.”
They look at the market. The new differential is a blowout due to the homeless barrels driving the price down.
The PADD2 refiner says: “Great, I’ll take my usual 3.3 million barrels, but I’m paying you the new price of $30/barrel, not the old price of $50/barrel.” (Assuming WTI at $65, Standard Discount $15 ending with a normal price at $50, and Stress Discount at $35)
Result: The “Crisis Spread” infects the entire supply chain. The Chicago refiner pockets the difference as a massive windfall margin.
Some volume is protected by fixed-price contracts or physical hedges, but typically ~70-80% of volume moves on monthly spot-index pricing. Therefore, the vast majority of exports immediately suffer the price drop.
Step-by-step breakdown of the daily loss.
· Total US Exports from Canada: ~4 Million bpd
· Scenario A (Before Venezuela Op):
WTI: $60. --- CURRENT APPROX PRICING AS OF 2026-01-08
Spread: $15.
WCS Price: $45.
Daily Revenue: 4M barrels * $45 = $180 million
· Scenario B (After PADD3 Lockout):
WTI: $60. --- CURRENT APPROX PRICING AS OF 2026-01-08
Spread: $40 (Pushed down to clear rail costs + panic)
WCS Price: $20.
Daily Revenue: 4M barrels * $20 = $80 million
The Net Loss: $180M - $80M = $100 Million/day loss
Annualized: $100M/day * 365 = $36.5 billion high end estimate
Is it realistic for Canadian Oil to trade at $20 while WTI is $60?
Historical Precedent: In November 2018, WCS traded as low as 14 USD/bbl while WTI was roughly $55 USD.
The Ratio: That was a ~75% discount to the benchmark.
Proposed $20 against $60 WTI.
This is a 66% discount.
Conclusion: Conservative. In a total lockout from PADD3 where storage tanks overflow, the price could theoretically drop to single digits (prices essentially go to zero if you physically cannot store the oil).
TERMS OF TRADE
The relationship between the CAD and the USD is not based on “feelings”; it is based on the net flow of capital required to settle cross-border trade.
If Canada loses ($180M – $80M) = $100M per day…
100 Million USD less demand for the Canadian Dollar every single day on the foreign exchange (forex) markets.
How a $36.5B revenue hole crashes the currency from 1.38 (72 cents) to ~1.66 (60 cents)…
The Missing “Buy Wall” - The Trade Mechanics
Currently, US refiners have to buy ~$180 million USD worth of CAD every day to pay for Canadian oil (or Canadian firms take the USD revenue and convert it to CAD to pay royalties, taxes, and wages). This creates a constant “Buy Pressure” under the Loonie.
When the revenue drops by $100M/day, that buy pressure vanishes.
The supply of CAD remains high (Canadians still selling Loonies to buy iPhones and oranges), but the demand for CAD (Americans buying oil) collapses by ~55%.
When sellers outnumber buyers in Forex, the price finds a new, lower equilibrium immediately.
The Multiplier Effect
The value of a currency is a reflection of a nation’s Purchasing Power.
Before Crisis: Canada sells 1 barrel of oil ($45 Netback) and buys 45 units of US Goods.
$60 - $15 WCS DISCOUNT STANDARD PRICE
After Crisis: Canada sells 1 barrel of oil ($20 Netback) and can only buy 20 units of US Goods.
$60 - $40 WCS DISCOUNT STRESS PRICE
The 55% is basically “how much purchasing power got destroyed” going from 45 units to 20 units.
Net Wealth Change: 55%
To balance the national checkbook, the currency must devalue. By dropping the CAD to 60 cents, it makes imports expensive (crushing consumption) and makes exports cheaper (encouraging other industries), mathematically forcing the trade deficit back toward zero.
The “Flight of Capital” - FDI Reversal
This is the psychological kicker that pushes the drop into “Crash” territory.
Global investors hold Canadian energy stocks (CNQ, Suncor, Enbridge) and Canadian Banking stocks.
The Panic: When the WCS Blowout hits, profitability for the entire energy sector (20% of the TSX) goes negative.
The Exit: Foreign investors sell Canadian stocks (Sell CAD) and move their money to US Tech or US Energy (Buy USD).
A massive outflow of investment capital stacks on top of the lost trade revenue. This is what broke the Loonie in 2015 and 1998.
The Interest Rate Gap - Bank of Canada Capitulation
If Alberta enters a depression due to the oil shock, the Bank of Canada (BoC) will panic.
Action: To prevent total economic seizure, the BoC will Cut Interest Rates aggressively to encourage borrowing.
Divergence: The US economy is booming (cheap Venezuelan energy). The Fed will keep US rates higher.
Investors will sell “Low Yield” CAD bonds and buy “High Yield” USD bonds. This widens the gap further.
Historical Validation: 60 cent Level
You might ask: “Is 60 cents unrealistic?” No.
2002: The CAD hit 0.6179 USD (1.61 exchange rate). This was during a period of low commodity prices.
The Difference Now: In 2002, Canada’s productivity was relatively better compared to the US. In 2026, Canada is more indebted and less productive.
A shock of this magnitude could easily push through the 2002 lows to the 0.58–0.60 range.
But Canada is not just an oil country…
The currency drop (~16%) is dampened relative to the oil revenue drop (~55%) because it is a diversified (though heavily weighted) economy.
The “45 units vs 20 units” math refer to the Buying Power of that specific Barrel of Oil.
Here is the “Weighted Math” that explains why a 55% collapse in Oil Revenue translates to a “only” a ~15-20% collapse in the Total Currency ($0.72 to $0.60).
The “Slice of the Pie” Logic (Weighted Averages)
Energy is massive, but it is not 100% of Canada’s exports.
The Breakdown: Energy products (Oil, Gas, etc.) account for roughly ~25% to 30% of Canada’s total merchandise exports.
The Other 70%: Cars, Minerals, Wheat, Services, Financial Products. These sectors are not losing 55% of their value overnight (initially).
The Calculation:
If 30% of your economy loses 55% of its value:
0.3( OIL_SHARE ) x 0.55( PRICE_CRASH ) = 16.5% impact on total exports
The Result: A 16.5% hit to the aggregate trade balance roughly aligns with a ~16% devaluation of the currency ($0.72 to $0.60). The currency re-prices to the weighted average of the damage.
Historical Validation: The 2014-2016 Crash
We can prove this logic by looking at the last oil crash.
Oil: WTI fell from $105 June-2014 to $30 Jan-2016
Drop: ~70% loss in Oil Value.
Currency: CAD fell from $0.94 to $0.68
Drop: ~27% loss in Currency Value.
The currency generally moves at 1/3rd to 1/2 the speed of the oil price crash because the rest of the economy acts as ballast.
TERMS OF TRADE Summary
The loss of $100M/day isn’t just a “loss of profit”; it is the removal of the floorboards under the currency.
It doesn’t matter that the pipe to Chicago is working fine. The Value of the Commodity inside the pipe has collapsed.
If you are an oil company in Calgary:
You produce 10 barrels.
8 go to Chicago (Safe). 2 go to Texas (Blocked).
Because those 2 are blocked, the market price at your front door drops by 50%.
You have to sell ALL 10 barrels at the 50% discount.
The Chicago buyers effectively get a subsidy paid for by the desperation of the Texas-destined barrels. Canada creates a sale on its own resources, transferring billions of dollars from the Alberta Royalty Pool to US Midwest Refining Margins.
Canada: Structural Recession
This is not a standard “business cycle” downturn; it is a Term-of-Trade Collapse.
Because the oil export market sets the value of the Canadian Dollar and funds the Federal equalization transfers, this event exports the pain from the Alberta oil fields directly to the Ontario grocery store aisle.
The Revenue Evaporation ($30B - $40B USD Loss)
The damage is not limited to the unsold oil; it infects every single barrel Canada sells.
This roughly equals the entire national Defense Budget. It wipes out roughly 2.0% - 2.5% of Canada’s total GDP in a pure cash-flow deletion.
Alberta: The Fiscal Death Spiral
The Province of Alberta operates as a petro-state within a federation. Its budget solvency relies entirely on royalty revenues fluctuating with price.
· The Royalty Trigger: Alberta royalties are on a sliding scale based on the WTI price.
High Price: Companies pay ~25–40% of revenue.
Low Price: Companies pay ~1–9% of revenue.
· The Impact: If WCS creates a realized price of ~$30/bbl (distressed), almost every project slides down to the minimum royalty tier.
Government Revenue: Plunges by 60-80%.
Budget: Immediate deficit explosion. Capital projects (hospitals/schools) halted.
Employment: CapEx budgets are cut to zero. Drilling rigs are stacked. This triggers a localized housing crash in Calgary/Edmonton similar to 2015, but worse due to higher interest rates.
The “Petro-Loonie” Crash (Imported Inflation)
This is how the crisis hits Toronto and Montreal. The Canadian Dollar (CAD) historically correlates ~85% with oil prices. But more specifically, it correlates with the Terms of Trade (the price of what Canada sells vs. what it buys).
· The Mechanism: Oil is Canada’s #1 generator of USD. When oil revenue drops by $36B, demand for the Loonie collapses on forex markets.
· The Valuation:
Status Quo: ~0.72 – 0.75 USD.
Scenario PADD3 Lockout: ~0.60 – 0.63 USD.
· The Consequence (The Serfdom Audit):
Canada imports 80% of its fruit and vegetables during winter (priced in USD).
Canada imports virtually all consumer electronics and machinery (priced in USD).
A 15% currency devaluation = 15% instant inflation on essentials for every Canadian citizen, regardless of whether they work in oil. The “Serfdom Score” of a Toronto tech worker worsens because their buying power evaporates.
The Production Shut-In: Physical GDP Loss
Beyond price, there is the Volume Loss.
Once the Midwest (PADD2) and Hardisty storage tanks fill up (roughly 4-6 weeks after PADD3 rejection), the physical displacement occurs.
· Forced Cuts: ~700,000 bpd must be shut in.
· GDP Effect: Oil and Gas extraction accounts for ~7-8% of Canada’s GDP directly. Chopping ~12% of that volume knocks another ~1.2% off National GDP strictly from stopped industrial activity.
· Statistics Canada estimates the employment multiplier for Oil & Gas extraction is roughly 2.7 to 3.0.
Capital Flight: A shut-in event forces industry Capital Expenditures (CapEx) to zero
Direct Jobs: Drilling/Extraction.
Indirect: Construction, Engineering (EPC firms), Transport.
Induced: Finance, Housing, Services (Truck sales in Edmonton).
Cutting 100,000 direct oil jobs evaporates 250,000 support jobs. The construction sector in Alberta (which builds the pads and pipelines) goes to zero immediately.
Tax revenues downstream of corporate and personal income collapse, pushing the total national GDP contraction to 2% - 3%.
We will explore how to mitigate this to possibly break even or not so catastrophic numbers in the later synthesis.
Geopolitical Checkmate: Political Instability
The economic pain creates a Constitutional Crisis.
· Equalization Payments: These are federal transfers from “Have” provinces (Alberta/BC) to “Have-not” provinces (Quebec/Atlantic).
· The Break: If Alberta goes bust, the Federal Government loses the funding source for Quebec’s social services. Ottawa has to either:
Massively increase federal deficit spending (Inflationary printing).
Slash transfers to Quebec (Political suicide/Separation risk).
Conclusion: A Second-Tier Economy
If the US shunts Orinoco oil into PADD3, Canada suffers a De-Industrialization Event.
· Alberta: Becomes a Rust Belt zone of insolvent heavy oil assets.
· Canada National: Becomes a pure client-state with a crushed currency (0.60 USD), suffering High Inflation and Low Growth simultaneously (Stagflation).
The ultimate irony: Canada invested $34 Billion tax dollars to build TMX (the pipeline to the Pacific) specifically to avoid this trap, but failed to permit the necessary port capacity (tanker bans) to make it matter. They built a bridge halfway across the river just as the flood arrived.
Albertan Secession

If Alberta is forced to be poor within the system, then it must find a way of escape. And Albertans have been thinking about this issue for a very long time.
The Equalization Payment system is the single most explosive political mechanism in Canada. It is the “Third Rail” of the Confederation. Equalization is the specific accounting ledger that fuels Albertan separatist sentiment. It is viewed in the West not as a “social safety net,” but as systemic colonial looting.
The Core Mechanic: Fiscal Capacity
Contrary to popular belief, the Government of Alberta does not write a check to the Government of Quebec. The mechanism is more subtle but mathematically equivalent in impact.
The Federal Government collects taxes (Income Tax, GST, Corporate Tax) from all citizens across Canada. Ottawa calculates each province’s “Fiscal Capacity”; how much revenue a province could generate if it taxed its citizens at the national average rate.
“Have-Nots”: If a province’s capacity is below the average (Quebec, Maritimes, Manitoba), Ottawa writes them a check from the federal pot to top them up to the average.
“Haves”: If a province’s capacity is above the average (Alberta, BC, Saskatchewan, Newfoundland), they get $0.
The Net Flows: The Looting
While Alberta doesn’t write the check directly, Albertans pay disproportionately high federal taxes because they have high incomes (derived from oil). Ottawa takes that money and sends it to Quebec.
The Current “Have” vs. “Have-Not” Map (2025/2026):
Alberta: Gets $0. (Has received $0 nearly every year since 1965).
Quebec: Gets ~$14 Billion/year. (Roughly 60% of the entire Equalization pot).
Atlantic Canada: Heavily subsidized.
The “Net Contribution” Statistic:
Economists estimate that since 1967, Alberta has made a net contribution (Federal taxes paid minus Federal spending received) of over $600 Billion. This wealth was effectively transferred to the East.
The Structural Trap: Resource Revenue Inclusion
This is the specific variable that makes Albertans furious.
When calculating “Fiscal Capacity,” the formula essentially treats Oil Royalties as regular income.
It creates a disincentive for other provinces. If Quebec were to develop its own natural gas or oil resources, its “Fiscal Capacity” would rise, and its Equalization checks would shrink.
Result: Quebec effectively gets paid to not develop its economy.
The Trap for Alberta: Even if Alberta runs a deficit (which it frequently does), it is still considered “Wealthy” because of its theoretical ability to tax. So Alberta can be cutting hospital funding to balance its own budget, while simultaneously sending Ottawa the same dollar amount.
The 3-Year Rolling Average (The Lag Phase)
This is critical for the Z_STRAT: OPERATION POMPEY scenario.
The Equalization formula uses a 3-Year Rolling Average of economic data to determine payments.
Scenario: PADD 3 stops buying Canadian oil in Jan 2027. Alberta crashes. Because the formula looks at the past, Alberta will arguably still be classified as a “Have” province for 2–3 years into the depression.
Outcome: Albertans will be unemployed, the province will be insolvent, yet Ottawa will still continue taking federal tax dollars out of the province (from the few surviving sectors) and giving zero support back. This creates the perfect “pressure cooker” for Secession.
It guarantees that the federal system effectively kicks Alberta while it is bleeding.
Why it is the “Suicide Pact”
For the Federal Government, Equalization is non-negotiable. It is enshrined in the Constitution Act, 1982.
Quebec’s Dependency: Quebec’s provincial budget is structurally reliant on that $14B transfer. Without it, Quebec would face immediate austerity or massive tax hikes.
The Dilemma:
If Oil (Alberta) collapses, the Federal tax base collapses.
Ottawa cannot afford to pay Quebec the $14B anymore without printing money.
If Ottawa stops paying Quebec, Quebec separates.
If Ottawa keeps paying Quebec (by taxing the West harder or printing money), Alberta separates.
Taxation Summary
The Transfer System is a Fair-Weather Construct. It works only as long as the “cash cow” (Alberta) is fat and happy.
In a scenario, where the US kills the cash cow (Venezuela substitution), the Transfer System becomes the mechanism that tears the country apart. It is a financial feedback loop that transforms an economic recession into a constitutional divorce.
Fiscal Capacity
The formula explicitly removes population as a variable to measure “Wealth Concentration.”
Fiscal Capacity is not a measurement of “How much money did the province collect?”
It is a simulation asking: “How rich is the dirt and the populace inside that border?”
Why “Fiscal Capacity” is the specific accounting mechanism that screws Alberta…
It is a “Per Capita” (Per Person) Cage Match
The Federal Government divides everything by population to create a “Per Person” score.
The Math: Total Potential Revenue ÷ Total Population = Per Capita Fiscal Capacity.
The Implications: It acts as a wealth-density scanner.
Quebec: ~9 million people.
Alberta: ~4.8 million people.
Why Population doesn’t matter: The system compares the Average Quebecois to the Average Albertan.
If the Average Albertan earns $100k, and the Average Quebecois earns $60k, Alberta has a “Higher Capacity.” The fact that Quebec has twice as many people is mathematically irrelevant because the scores are normalized.
The Average Rate - The Simulation
This is the Phantom Math that enrages Western politicians.
Ottawa does not look at what a province actually taxes; they calculate what it would make if it taxed like the rest of Canada.
The Mechanism:
Calculate the Standard: Ottawa looks at every province and calculates the National Average Tax Rate for 5 categories (Income, Consumption, Property, Resources, Business).
The “As If” Audit: They take that Average Rate and apply it to Alberta’s economy.
Example (Sales Tax / GST):
Alberta has 0% Provincial Sales Tax (PST).
The National Average PST rate is roughly 6–8%.
The Trap: Ottawa calculates Alberta’s Fiscal Capacity AS IF Alberta was charging 7% PST.
Result: Ottawa says, “Alberta, you have $10 Billion in Fiscal Capacity from sales tax.”
Alberta says: “But we collected $0!”
Ottawa says: “That’s your problem. You could have collected it because your citizens are rich enough to spend money. Therefore, you are a ‘Have’ province and get no help.”
Why Alberta Loses
Fiscal Capacity measures the richness of the source, not the number of people.
The Resource Revenue Distortion:
In the Equalization formula, the revenue from Natural Resources (Oil/Gas) is included (specifically 50% or 100% of revenues, depending on which calculation favors the recipient, but usually acts against the generator).
The Oil Rig vs. The Cafe:
Ontario/Quebec Economy: Driven by labor (Services/Manufacturing). Tax revenue is steady but lower density per person.
Alberta Economy: Driven by Resource Rent (Oil Royalties). A single oil well generates massive revenue with very few people involved.
The Result: Because Alberta extracts massive wealth from the ground with a relatively small population, its “Per Capita Capacity” is off the charts.
In recent years, Alberta’s capacity was often $12 000 per person; while the national average was $9 000 per person.
The gap ($3,000/person) defines them as “Hyper-Rich” in the formula’s eyes, even if the government is running a deficit because it keeps taxes low.
Fiscal Capacity Summary
It isn’t about how many people you have; it’s about Yield Per Human.
The Myth: “Alberta contributes more because it has people working hard.”
The Fiscal Reality: Alberta contributes more because the Tax Base per Person (Wages + Oil Rights + Corporate Profits) is massively higher than anywhere else.
By losing the PADD 3 exports (Venezuela Scenario), the Value of the Oil drops. This crashes the “Resource Revenue” portion of the Fiscal Capacity formula.
The Crisis: Suddenly, Alberta’s “Yield Per Human” crashes.
The System’s Failure: Because the formula uses a 3-year rolling average, Ottawa will still say Alberta has “High Capacity” (based on 2024–2025 oil prices) well into the 2027 collapse. They will treat a starving province as a rich one until the math catches up in 2030.
Or Canada can just stop using the “AS IF” system. That would be a lot simpler.
“Motivated” timeline to build a duplicate pipeline is roughly 5 years…
The Historical Baseline: TMX 1.0
Total Duration: 11 Years (Dec 2013 Application to May 2024 Operations).
Construction Duration: ~4.5 Years (Late 2019 to May 2024).
Cost: ~$34 Billion CAD (Ballpark).
Was it unnecessarily delayed? Yes, grotesquely.
The “Burned” Time: Roughly 6.5 years was spent on “Paper Warfare.”
Federal Court of Appeals overturning approval (2018).
British Columbia provincial government obstruction lawsuits.
Kinder Morgan giving up and selling to the Crown (Federal Gov).
The Engineering Reality: TMX suffered major physical delays in 2021 (Atmospheric Rivers washed out the Coquihalla highway/infrastructure) and 2023 (Hard rock drilling issues in the Mountain 3 tunnel section).
Without the political/legal warfare, the project was an ~5–6 year endeavor (2 years planning/permitting + 4 years building).
The War Speed Timeline: TMX 2.0
Let’s assume the scenario: It is Jan 2027. PADD 3 has locked out Canada. WCS prices are $20. The Canadian Government declares a National Economic Emergency and invokes emergency powers to force a new pipeline through to Prince Rupert (Northern Corridor) or a third line to Vancouver.
Here is the fastest physical timeline possible, assuming zero legal opposition.
Phase 1: The “Paper” (0 – 12 Months)
Legislative: Repeal Bill C-48 (Tanker Ban) and Bill C-69 (Impact Assessment Act). Use the “Notwithstanding Clause” to override judicial challenges on environmental grounds.
Route: Revive the old Northern Gateway blueprints (Prince Rupert). The engineering data already exists from the 2010s. You don’t need to re-survey.
Procurement: Ordering 1,100km of high-tensile steel pipe takes 6-9 months minimum. Steel mills have backlogs.
Phase 2: The “Mud” (Months 12 – 48)
Construction Speed: You cannot build a pipeline in the Rockies as fast as in Texas.
Terrain: You are blasting granite and crossing avalanche chutes.
Seasonality: You effectively lose 4 months of the year to hard winter/mud season where heavy equipment bogs down or unsafe conditions prevail.
The Labor Cap: You need ~10,000 highly specialized welders and operators. Labor in Canada is tight. You would likely need to import crews from the US (Texas) or fly in squads to work 24/7 shifts.
Phase 3: The Terminal (Months 24 – 60)
The Bottleneck: Building the pipe is faster than building the Port Facility.
Building a Deep Water Oil Terminal (at Prince Rupert) requires massive dredging, tank farm construction, and loading arms. This is complex marine engineering.
The “Crisis” Calculation:
Planning/Mobilization: 1 Year.
Construction: 3 Years (Accelerated from 4.5).
Commissioning/Fill: 6 Months.
Total Time: 4.5 Years.
The Fatal Timing Mismatch
PADD 3 displaces Canada in 2027.
Even with a WWII-style mobilization, TMX 2.0 comes online in 2031/2032.
Canada spends 4–5 years selling oil at a $40 WCS DICOUSNT with $36B/year loss) before the rescue infrastructure is ready.
A pipeline is a 5-year antibiotic course. The Venezuela displacement is a gunshot wound.
The delay in TMX 1 was not just “bad luck”—it was the Time Tax that Canada paid, which ensured they would miss the window to prepare for the 2027 energy shift.
The window is now closed.
Rail Operational Pivot and Bill C-48
Lifting Bill C-48 (The North Coast Tanker Ban) is the single most effective legislative “Emergency Brake” Ottawa could pull.
It would not fix the profit margin, but it would save the volume.
But the timeline runs headlong into a concrete wall: Terminal Physics.
Even if the law disappears today, Prince Rupert does not have the liquid storage infrastructure to handle the volume.
Rail-to-Prince Rupert Contingency Plan
The Economics: Rail is the Cap
Rail costs ($20 per bbl) are roughly 2x to 3x higher than pipeline costs ($7-10).
Why it still makes sense:
The Crisis Scenario: Without an outlet, WCS trades at a $40 discount (Shut-in Economics).
The Rail Scenario: Even with high costs, rail “Arbitrages” the spread. It sets a floor. If you can rail it to Asia for $20, the WCS differential is stabilized. You aren’t making good money, but you aren’t shutting in wells.
You are surviving. It effectively puts a tourniquet on the bleeding. Instead of losing $100M/day, Canada loses $40M/day.
The Physical Problem: The Phantom Terminal
Prince Rupert is a world-class port for Container, Coal, Grain, and Propane (AltaGas).
It does not have a dedicated Crude Oil export terminal.
The Tank Farm Constraint: To load a Supertanker (VLCC - 2 Million barrels), you need massive storage tanks on shore to accumulate the oil from the trains.
Math: A “Unit Train” carries ~60,000–70,000 barrels. You need ~30 Unit Trains to arrive just to fill ONE supertanker.
Without a tank farm to buffer that flow, the ship sits there for 2 weeks waiting for trains. Demurrage (docking fees) destroys the profit.
The Construction Lag: Building a heated tank farm and liquid loading arms takes 18–24 months minimum. Even if they break ground today (Jan 2026), it’s not ready for the Jan 2027 contract expiration in PADD 3.
The “Solid” Alternative: Hopper Cars
There is one weird trick that might work in 1 year.
Dilbit (Bitumen + Diluent): Liquid. Needs Tanks. (Problem).
Raw Bitumen (Solid-ish): Canada experimented with “CanaPux” (turning bitumen into solid pucks/pellets) or using specialized “Coil Cars” (heated rail cars) to move raw sludge.
The Win: If you move it as a semi-solid or puck, you can use existing Coal Terminals (Ridley Terminals) to dump it onto ships like bulk ore.
BUT No Chinese refinery wants “Pucks.” They want fluid. You solve the transport problem but create a refining headache on the receiving end.
Rupert Rail and C-48 Pivot Summary
Lifting C-48 is the right move and you have to do it RIGHT NOW.
Economics: Expensive ($20 transport). It keeps the industry alive, but profitability collapses.
Timing: Misses the 2027 deadline. You face a “Gap Year” of maximum pain while tanks are built.
Canada effectively checkmated itself. Even if they repeal the law today, they cannot pour concrete fast enough to beat the US Refinery Contract cycle.
This still remains best single possibility for Canada. Accepting the pain of 1 year if OPERATION POMPEY deploys.
We shall see if the political will and foresight exists to ensure the Canadian Confederation still exists.
The fact that there is current ZERO observable action in this manner shows that CIA has analysis and wargaming the Canadian Government does not.
Canada is simply not planning for the US to deploy OPERATION POMPEY.
This is either incompetence or ignorance by Canadian Intelligence.
War Planning demands action for
WORST
CASE
SCENARIO
Trump: One of the Greatest Presidents Ever
What follows is the highest WIN scenario for the US.
If Trump achieves this, he WILL be remembered as an all time great.
This feat will match Kissinger’s Petrodollar system establishment.
The US has the potential to control within continental reach the world’s largest oil reserves. End of story.
This is a ruthless application of Optimal Zero Sum Game Theory.
If the US administration is even remotely aware of any of the above math, they will conclude there is an optimal move set.
We are talking about the highest paid intelligence analysts. They probably have the math. And they are probably real mad their move set got exposed.
If they don’t, then it means the CIA is again running circles around mainstream analysis and black-intel. And you’re getting this information for free versus the millions it would cost to assemble this report.
US_Z_STRAT: OPERATION POMPEY
By capturing the specific physical valve where diluent enters the system, you effectively own the entire output of the nation without needing to occupy every square inch of the jungle oil fields.
Complex upgrading, refit, repair is not needed. Only the current Orinoco output of 700 000 bpd is enough to crash the Canadian economy.
Complejo Jose - The Throat
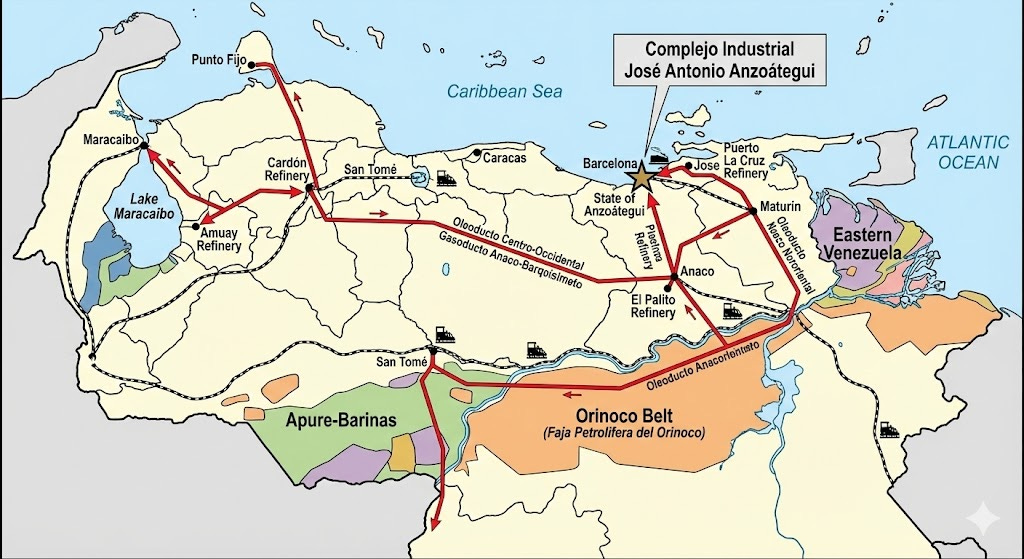
The vast majority of Orinoco upgrading, blending, and export happens at a single coastal location: The Jose Terminal (Complejo Industrial José Antonio Anzoátegui), located near Barcelona on the northern coast.
Orinoco crude is piped here to be mixed. It cannot be loaded efficiently onto Supertankers (VLCCs) at other random ports.
The terminal uses Single Buoy Moorings (SBMs) offshore to handle deep draft vessels.
The US Navy does not need to patrol the entire Caribbean coastline. They simply need to park a destroyer group or Coast Guard off the coast of Jose Bay.
It is a physical “White List.” Only US-flagged or US-permitted tankers carrying the specific chemical DNA of US Permian Naphtha are allowed to dock. Everything else (Iranian condensate, Russian products) is turned away or seized.
The End of “Mystery Shipments” (Ghost Busters)
During the sanctions era (2019–2025), Venezuela survived via Ship-to-Ship (STS) Transfers offshore.
· An Iranian ghost ship turns off its transponder, meets a Venezuelan ship in open water, pumps condensate over, and leaves.
· With US military dominance in the theater, the airspace surveillance and naval radar coverage becomes total. An STS transfer of heavy crude takes 24–48 hours. A dense liquid cannot be moved quickly.
Surveillance: A Global Hawk drone or Satellite spots two ships side-by-side.
Interdiction: A US destroyer intercepts.
The Dark Fleet abandons the theater. The risk premium becomes infinite.
Total “Input Control” - The Valve
This allows the US to control the Venezuelan Output Rate by throttling the US Diluent Input Rate.
· No Diluent = No Transportable Oil.
· The US State Department doesn’t need to govern the messy internal politics of Venezuelan unions or field workers. They simply calculate: “We need 1.0 million barrels of Merey for Texas refiners this month.”
Action: They authorize exactly 300,000 barrels of Naphtha to be shipped South.
Venezuela physically cannot produce more oil than the solvent allowed in.
· The Venezuelan local government (whoever is installed) acts merely as the “Well Operator.” They cannot hoard oil or sell it to China behind the US back, because without the US Naphtha ships, their pipes turn into solid wax plugs within 48 hours.
Control Conclusion
The logistical simplicity of this blockade confirms why the operation is a “Win” despite the ruined internal infrastructure.
1. Concentrated Vulnerability: All the “blending” happens at Jose. You only have to hold one hill to own the battlefield.
2. No Leaks: The chemistry prevents smuggling. You cannot “smuggle” solid bitumen out of a jungle in a backpack. You need massive pipes and massive ships. Both are easily seen and blocked.
3. Absolute Hegemony: The Venezuelan oil industry effectively becomes an extraterritorial department of PADD 3 Texas. The feedback loop is closed.
Positive Control
Doctrinal Definition:
“A method of regulation where a system operates only with explicit, continuous validation and authorization. Without the active ‘keep-alive’ signal (The US Naphtha Shipment), the system defaults to a ‘Fail-Safe’ state (Total Shutdown).”
· Ownership: Venezuela has ceased to be a country and has become a US Strategic Asset that requires permission to operate.
· Binary Outcome: There is no negotiation. There is only
Compliance - Flow
Non Compliance - No Flow
The media sees a military occupation. The energy markets see a supply disruption. But the Pentagon planners see something else: Positive Control. By seizing the Diluent input valve at Jose, the US has installed a Dead Man’s Switch on the Venezuelan economy.
If Washington doesn’t send the ‘heartbeat’ signal (Naphtha), the patient (Caracas) flatlines in 48 hours. Venezuela is no longer a state; it is a toggle switch on the US energy dashboard.
POMPEY_PHASE_1: Controlled Diluent Supply Loop
2026-01: The US ocean battle group begins securing a safe corridor from PADD3 to Venezuela.
Only approved Diluent VLCCs can dock to load/unload.
No more mystery shipments. China et al can no longer get sanctioned oil for cheap. Everybody now has to pay a fair market rate. Plus a small % for the US maintaining the security of the shipping lanes.
The US controls how much is bitumen export and how much is sent to PADD3 for value added refining. There’s nothing to complain about. Officially, Orinoco oil was always sanctioned. Nobody should have been buying it. So technically, nobody should be missing it.
POMPEY_PHASE_2: Slow Roasted Loon
The US once satisfied with shipping safety can begin the squeeze on the Canadian economy.
It diverts all Orinoco bitumen to PADD3. This can occur around 2027 as contracts rollover and refiners no longer need to honor Canadian deliveries. They now take Orinoco bitumen.
The first chance for a systemic refusal is “Term Contract Season” (Q4 2026) for deliveries starting January 1, 2027. These consist of 70% of all contracts.
However, the Spot Market allows the US to start twisting the knife much sooner, roughly May 2026. 30% of contracts are spot.
This deprives China of their asphalt feedstock. China has no contractual legal claim on this. If they objected, it would mean they were knowingly buying sanctioned oil.
And per the math extensively detailed, it begins to implode the Canadian economy.
The US only cares about Alberta. It gives them a choice.
A very attractive choice. Guaranteed PADD3 quotas. Full autonomy.
Without the burden of Federal Canadian transfer payments, even half the current bitumen shipments make Alberta a very rich “state.”
Alberta struggles with this for some time. They eventually accept. The Liberal government has taken too much from Albertans for too long.
2027-06: The Confederation Cracks.
POMPEY_PHASE_3: Normalization
2028-01: The oil market is normalized. Venezuela’s bitumen is now allowed to ship wherever it is needed. Alberta tar sands is sent to PADD3 for upgrading as normal. Canada-Proper is a shell without Alberta’s transfer payments. People begin mass emigrating out of a hollow paper wealth economy.
The world economy operates normally again.
The US now controls all the oil reserves it might need. Not only that, it has heavy feedstock which can be refined into any particular form desired. US now has full pricing control over the largest bitumen supply in the world.
THE AMERICAN CENTURY
Most polite mainstream geopolitical modeling respects existing alliance structure. We see no reason to carry that as a modeling prior.
This sequence of events maximizes resource control, power and prestige for the US.
They either already know this sequence or will know it once this dispatch circulates.
It would be foolish to look like the “Bad Guy” and then not choose this optimal solution. In fact, the CIA would be very surprised if the US did not deploy OPERATION POMPEY. It would be wasted opportunity for the IMPERIUM.
If we start watching the US sprint to blockade and then ship approved diluent to Venezuela, they intend on taking deploying the Positive Control model. OPERATION POMPEY will have been confirmed at least partially.
OPERATION POMPEY would allow the US to subsume the Americas oil reserves. Weaken its main rival China economically by charging higher prices. And strip the single most valuable asset for its Northern neighbor.
It has now achieved energy dominance for the foreseeable future.
WORLD_Z_STRAT: Defying the American Century
Theater of War: World
Belligerents: All
Timeline: Now
Now the chess board is plain to see. The US has an optimal move set. The other players cannot allow the American Century to emerge.
EU: Immediate diplomatic and if necessary, military action to prevent Hegemonic accumulation of energy resources.
China/Canada: Immediate cooperation with Canada for infrastructure build up.
Rest of World: Pick a side; what flavor of multipolarity makes you happy.
Alberta
Canada must woo the Albertans back into confidence. Concessions will need to be made. If OPERATION POMPEY is successful, the carrot will be held by the US.
Now the timeline has been rigorously established with regard to chronology and economic impacts, Alberta can decide pre-emptively.
Will they choose historically exploitative Canada?
Or the US Hegemon. Perhaps they may be treated better here?
Or perhaps it is same trade. The same exploitation no matter what.
Z_STRAT_SUMMARY
The state of alliances is fluid and conditional.
Canada has crippled itself economically as a result of longstanding policies.
The impact of the US refusing PADD3 bitumen imports will crush the Canadian economy.
A potential negative $36 billion per year loss, declining living standards, and import inflation.
Action is required by all parties now to prevent The American Century and OPERATION POMPEY.
Alberta now plays a decisive role shaping the 21st century.
Quote not laws to us with swords.

WARGAME SIMULATION ONLY
CIA IS NOT RESPONSIBLE FOR KINETIC OUTCOMES
REQUIRED READING BELOW FOR OPERATORS
The Venezuelan Oil Saga
Read in this order to get the full picture…


Whoever you are, this has been one of the most stimulating and interesting reads I have read in years. Do not ever stop sharing your view on the world's moving parts, as it would be a crime!
Finally a comprehensive 21st century power politics update to Daniel Yergins “The Prize”. Exceptional piece of analysis and writing.