
UN World Population Prospects 2024 Summary of Results
A close look at the United Nations modeling, assumptions and resulting outputs.

UN versus other Academic Models
Directly quoted from the UN WPP2024 summary PDF:
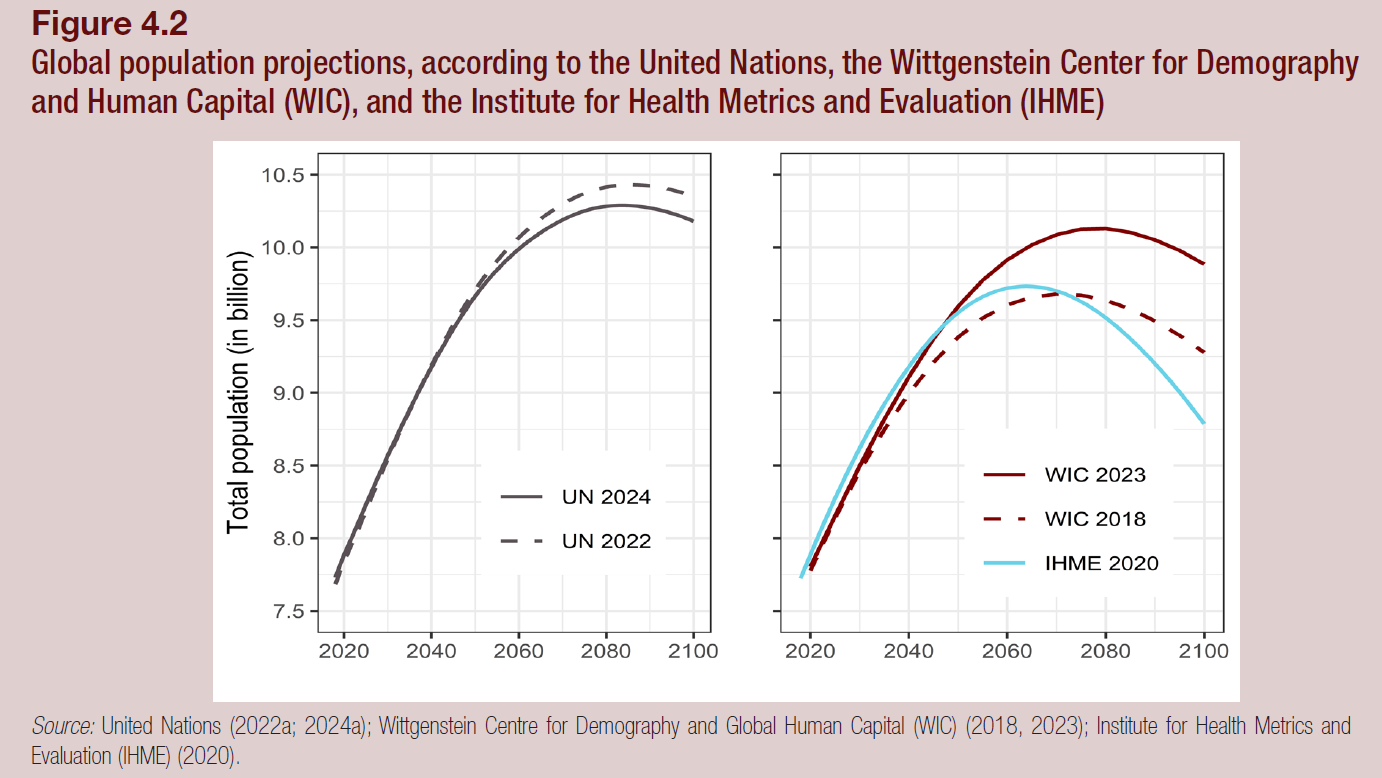
Long-term global population projections are crucial for planning and policymaking, but they can vary significantly due to differences in methodologies, assumptions, data sources and when they were produced. Three leading institutions currently produce global population projections: (a) the United Nations (World Population Prospects), (b) the Wittgenstein Center for Demography and Human Capital (WIC), and (c) the Institute for Health Metrics and Evaluation (IHME).
All three sets of global projections use the cohort component method to project future population by age and sex. Under the cohort component method, the population by age and sex in a given year is projected forward by applying mortality, fertility and migration patterns that differ by age and sex. These rates are obtained by the application of different models and/or methods that are based on distinct assumptions. The methodology used by the United Nations is described in a separate report (United Nations, 2024b).
At the global level, the different sets of population projections agree until about 2050, and thereafter they diverge progressively (figure 4.2). In their most recent assessments (WPP 2024 and WIC 2023), the projections of the global population by the United Nations and by WIC have become closer and depict a very similar future trajectory until the end of the century when the world could count 10.2 billion (ranging from 9.0 billion to 11.4 billion, with a probability of 95 per cent) (UN 2024) or 9.9 billion (WIC 2023) respectively. In contrast, IHME (2020) projects a future global population of 8.8 billion (ranging from 6.8 billion to 11.8 billion, with a probability of 95 per cent) in 2100 – a figure 1.4 billion, or almost 14 per cent, lower than that produced by the United Nations.
The UN acknowledges the differences in assumptions and methodology can cause predictions to vary wildly.
All 3 use the cohort component method of demographic birthing, ageing and deaths.
The UN LOW and IHME LOW prediction differs by 30%, leading to a phantom population disagreement of 2B humans.
UN Demographic Transition Curve
Directly quoted from the UN WPP2024 summary PDF:
“Why do populations reach a peak size?
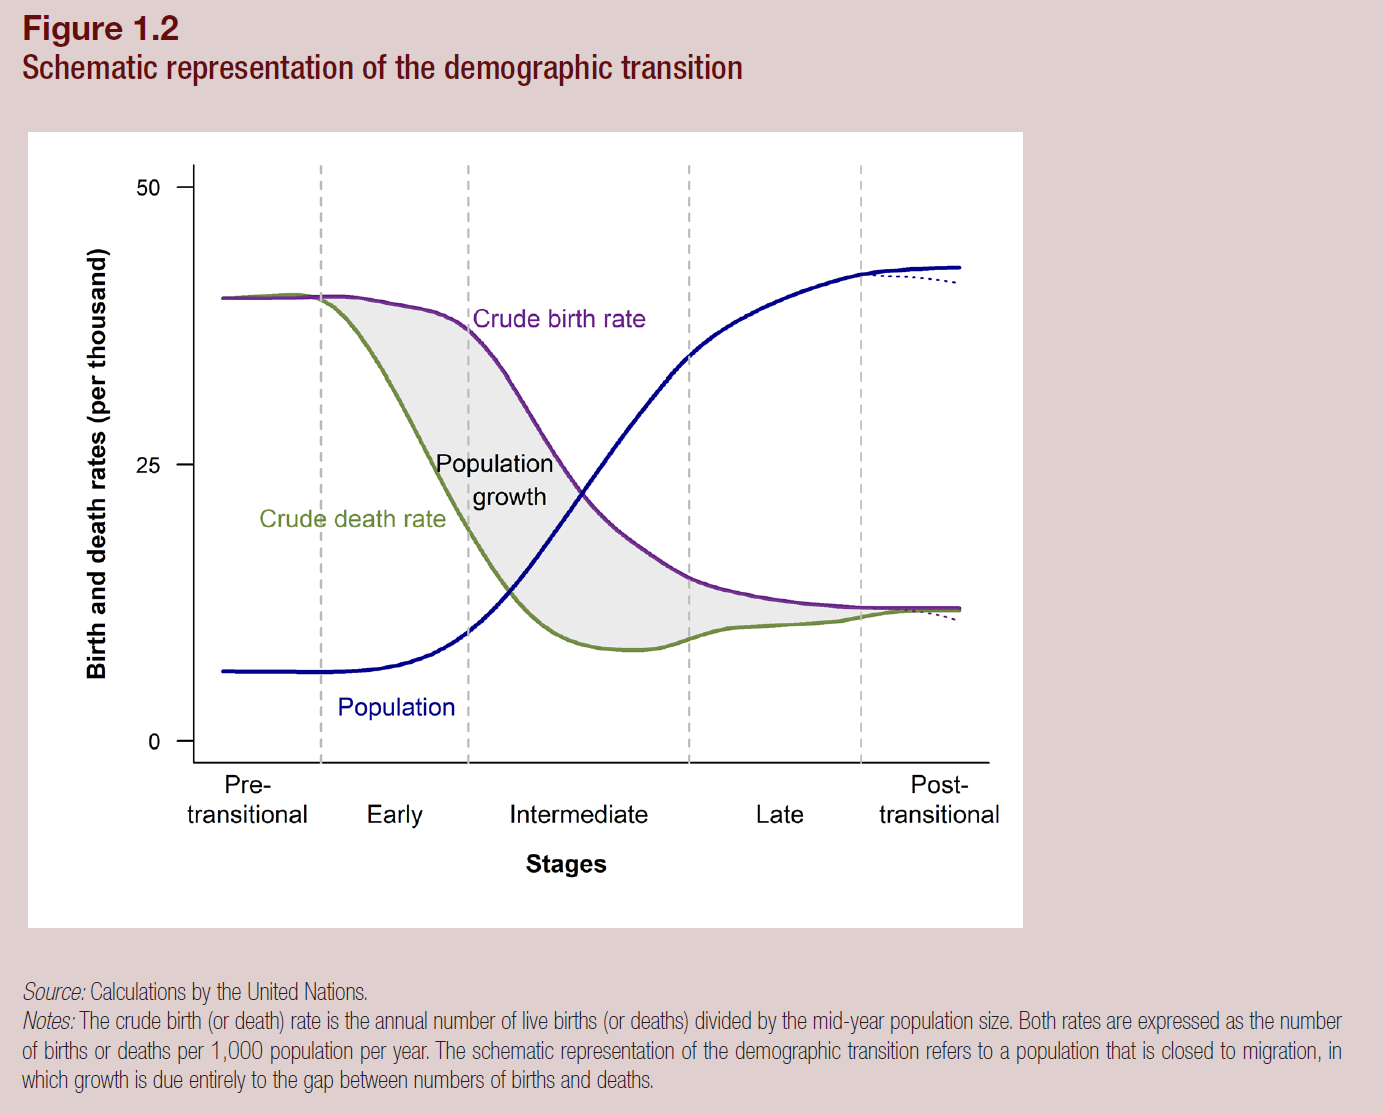
The fact that contemporary populations tend to grow, reach a peak size and then plateau or decline is a consequence of the demographic transition—the historic shift towards longer lives and smaller families that has been a universal feature of social and economic development in the modern era. The transition unfolds in a series of stages. In the early stage, the transition is characterized by accelerated population growth driven by a drop in mortality rates, especially among infants and children, while fertility levels remain high. In an intermediate stage, fertility begins to decline as well, but the population continues to grow rapidly due to a large and sustained excess of births over deaths. As the transition moves into its final stage, population growth decelerates as birth and death rates come back into balance at historically low levels, until eventually the growth rate approaches zero or becomes negative. At that point, the transition is complete. Once a population reaches its peak size, the population tends to stabilize with a growth rate close to zero (figure 1.2, post-transitional solid trend line) or to decrease in size with a negative growth rate (dashed trend line).”
This is a direct visualization of the UN’s demographic transition function.
Two parameters will be of immediate consequence in regards to downstream population prediction.
The temporal span of the transition from high to low. If a country has a short temporal span, the TFR decline will likely be rapid.
The slope of TFR and death rates. Manipulating these parameters would obviously change how fast TFR declines and how fast mortality improves. This has a direct effect on the resulting population curve.
The demographic transition can be approximated by the ASFR (Age Specific Fertility Rate) instead of raw TFR values.
We can reliably categorize a country or region as beginning its transition curve or already in the mature stage. The pattern is very robust in that we can observe women having children earlier in life as indicative of within the early part of the demographic transition curve.
Conversely, countries/regions with women on average recording ASFR values at 30 years of age, can be reliably placed into the far end of the demographic transition curve.
This means we can place a rough trajectory slope on the TFR curve itself. Early transition countries will likely decline quite heavily. And mature countries will likely stabilize their TFR rates.
All long term prediction rely upon the interaction of assumptions for temporal span of a regions demographic transition curve, the actual slope of TFR and mortality, and the categorization of the region’s placement within the demographic transition curve.
This is why all predictions should come with a disclaimer and error bands. Below we will discuss the actual numerical effects of these parameters.
Unfalsifiable Predictions
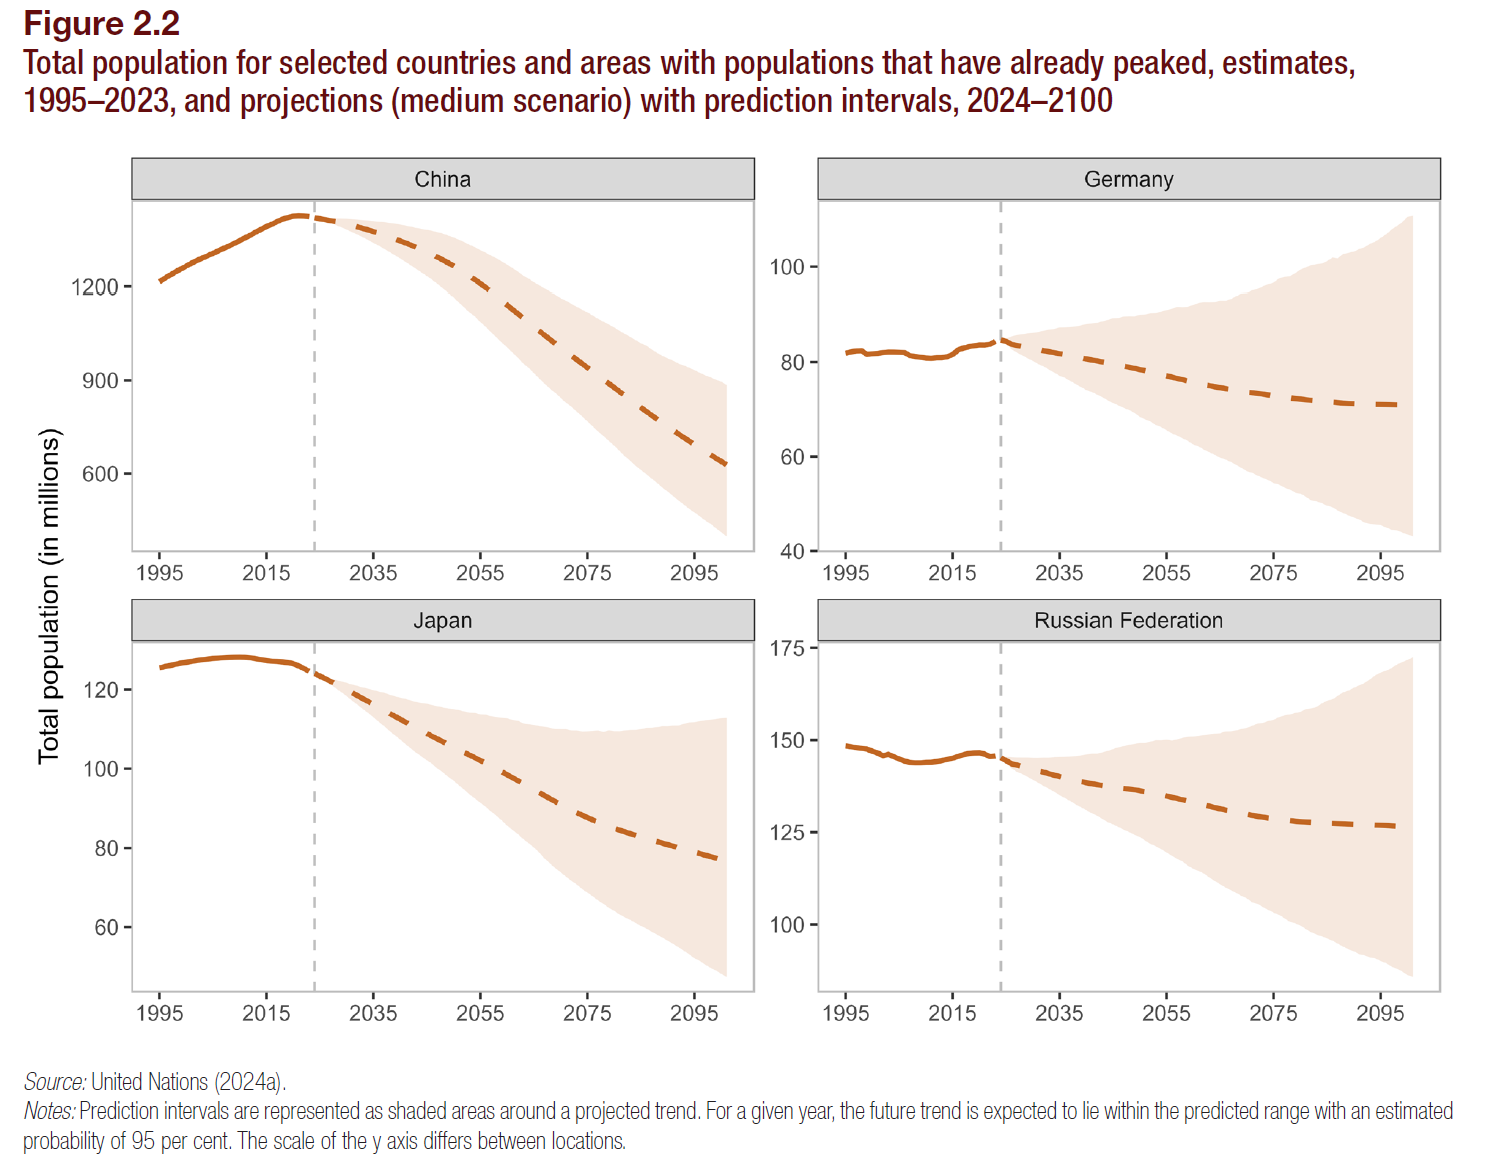
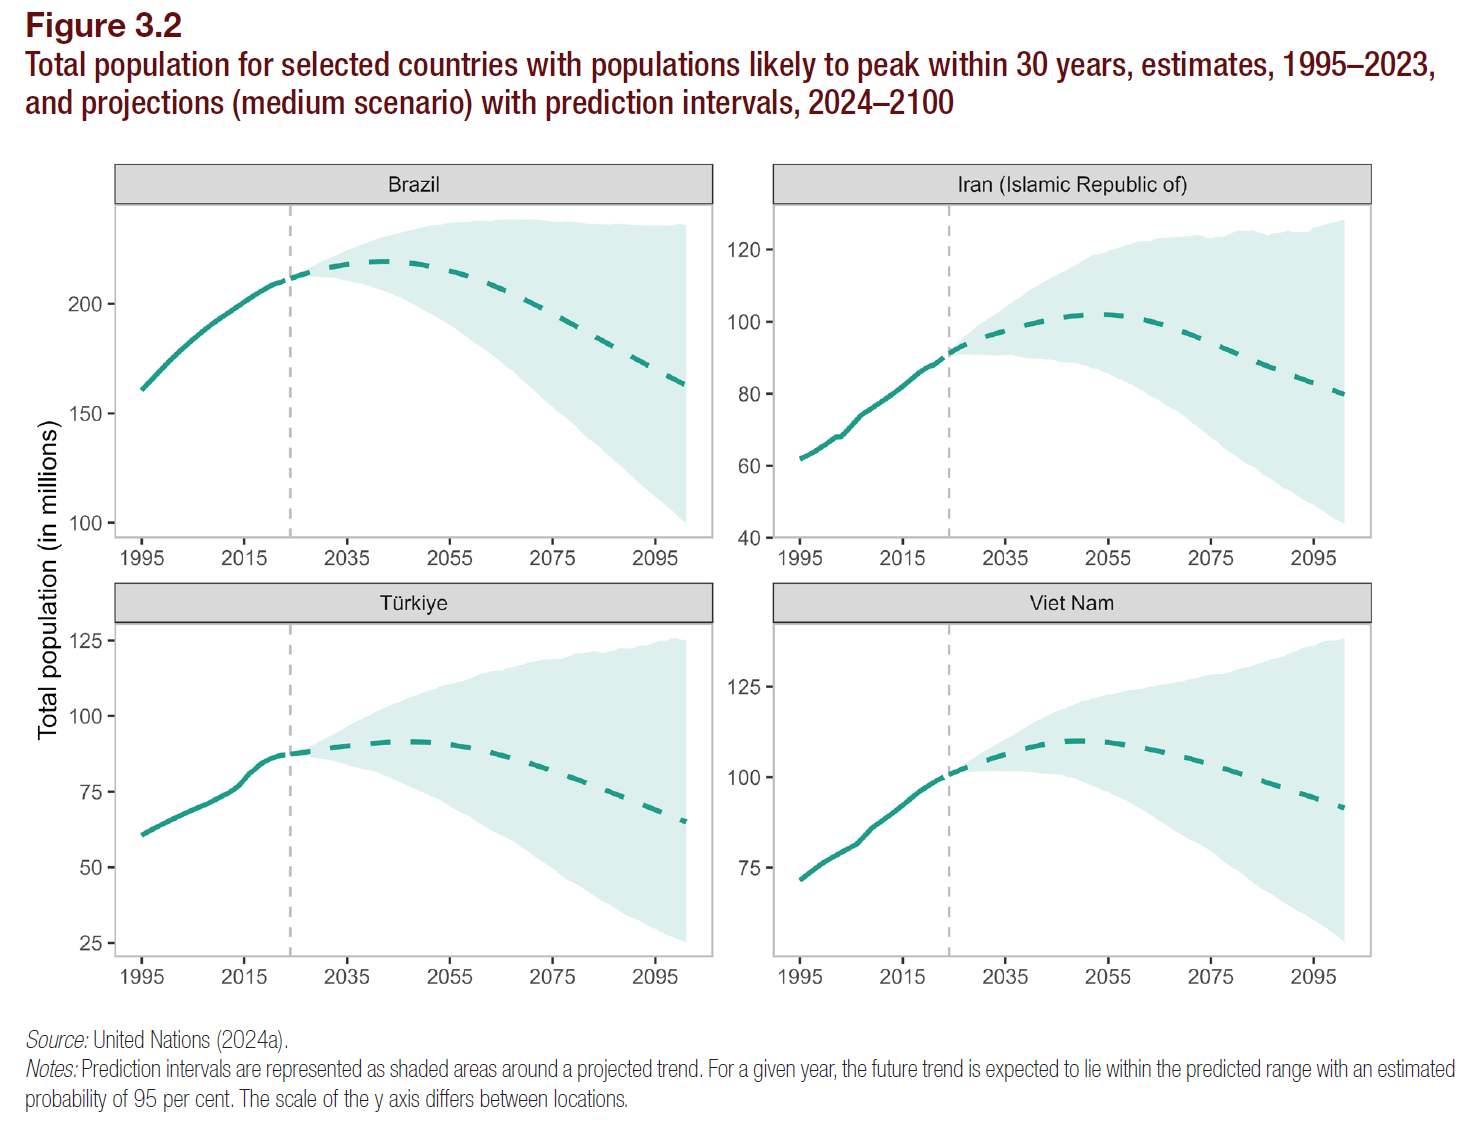
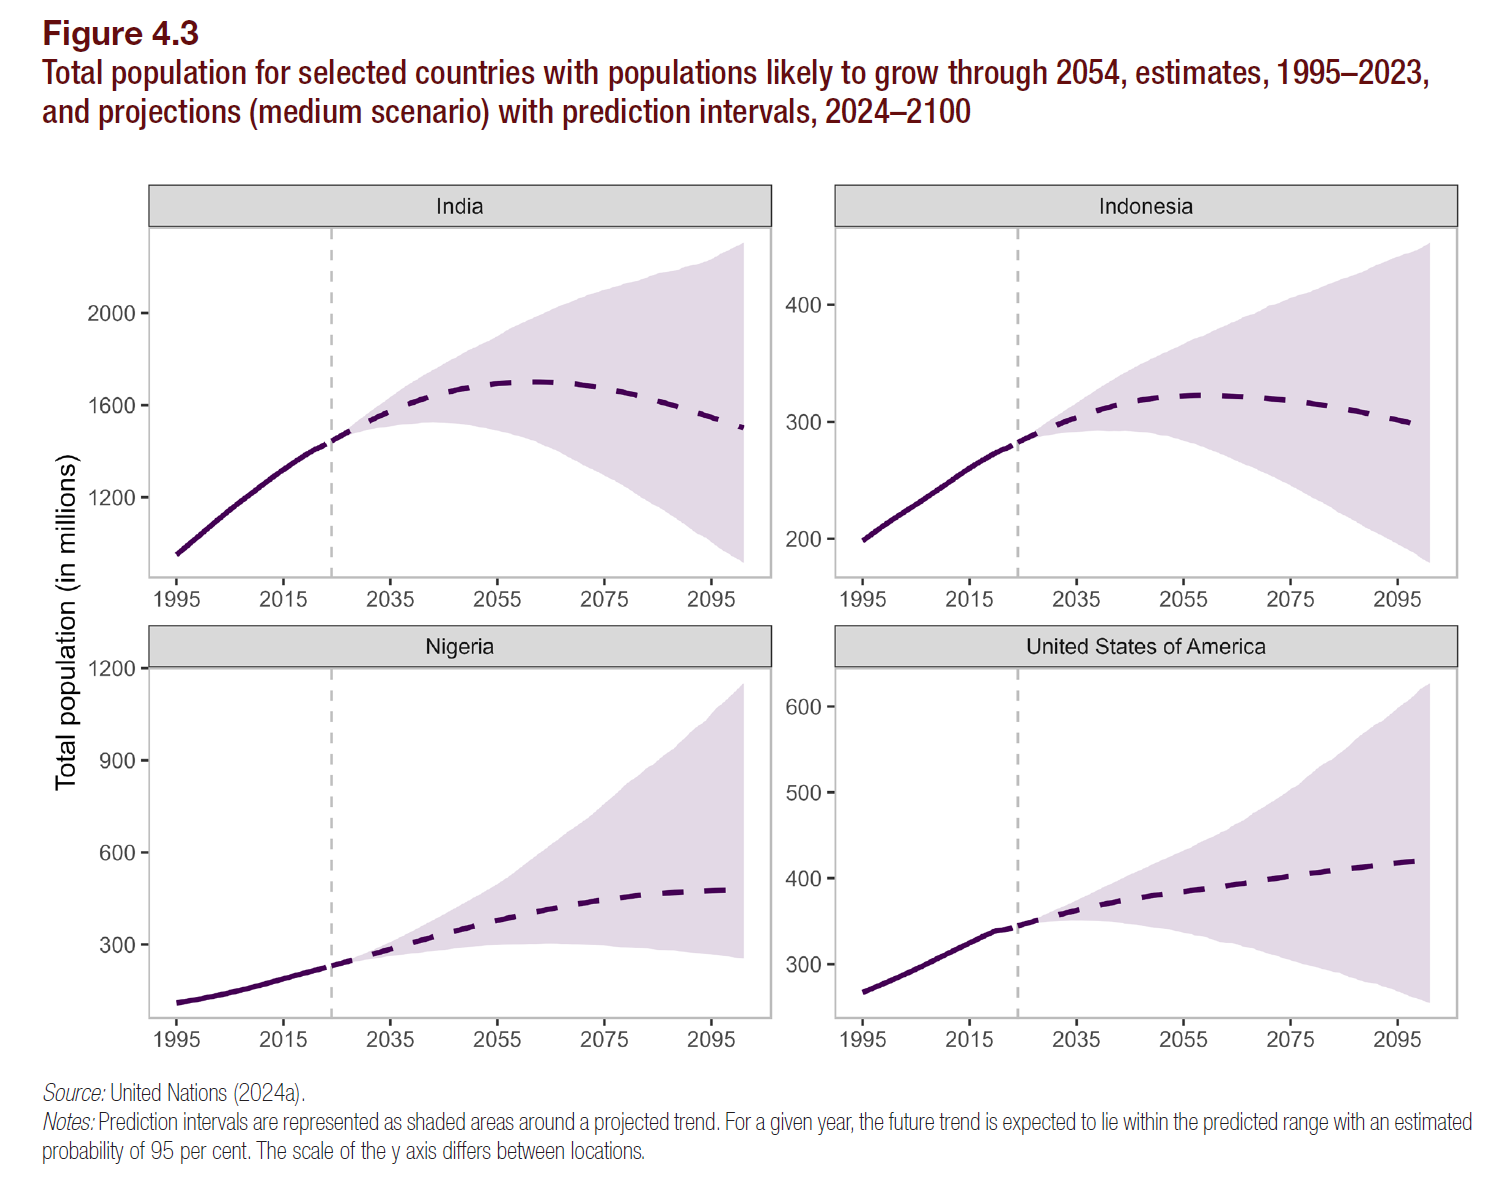
The graphs presented above demonstrate the wide prediction bands for the UN.
This flaw was outlined in: United Nations - Glasshouse of Questionable Assumptions.
This forecasting is unfalsifiable.
Suppose you ask someone what the outcome of a coin flip will be. And their answer: I am confident the outcome will be either heads or tails.
A close look at the lowest vs highest prediction band, we can observe a 100% swing in population.
CIA BRIEF
The UN has become a “brand”. People are putting their trust into an institution as an appeal to authority.
The UN says it will be true so it must be true. The effect of parameter tuning generates bands too wide to be of predictive value.
This is no longer science.
PREVIOUS

NEXT
